
Yo uso desde hace unos años TradingView y siempre echaba de menos tener datos fundamentales de las empresas vistas a lo largo del tiempo como hace Simplywal.st.
Pues bien, hace un tiempo dieron la posibilidad de crear indicadores en base a datos fundamentales así que busqué si alguien había hecho uno y vi que no. De manera que hice uno separado en las 4 secciones de datos que me gusta mirar. El código está hecho en inglés y lo publiqué en la plataforma.
- Revenue & earnings
- EPS & DPS (EPS, EPS estimate, DPS and dividend payout ratio )
- Debt (total debt, total equity and cash & equivalents)
- Returns (ROE, ROIC, ROA and R&D revenue to ratio)
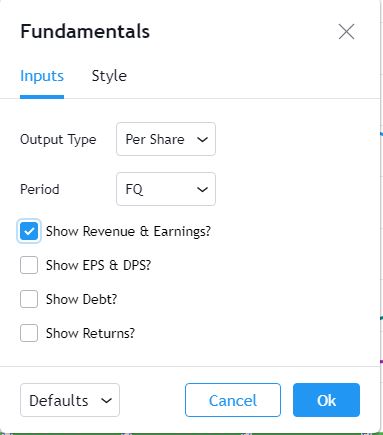
En la pantalla de configuración doy la opción de indicar una de cada 4 secciones, recomiendo seleccionar solo uno de ellos, en otro caso, el gráfico es un desastre. También puedes indicar si quieres ver los datos por trimestre fiscal (FQ) o por año fiscal (FY).
Algunas capturas de pantalla
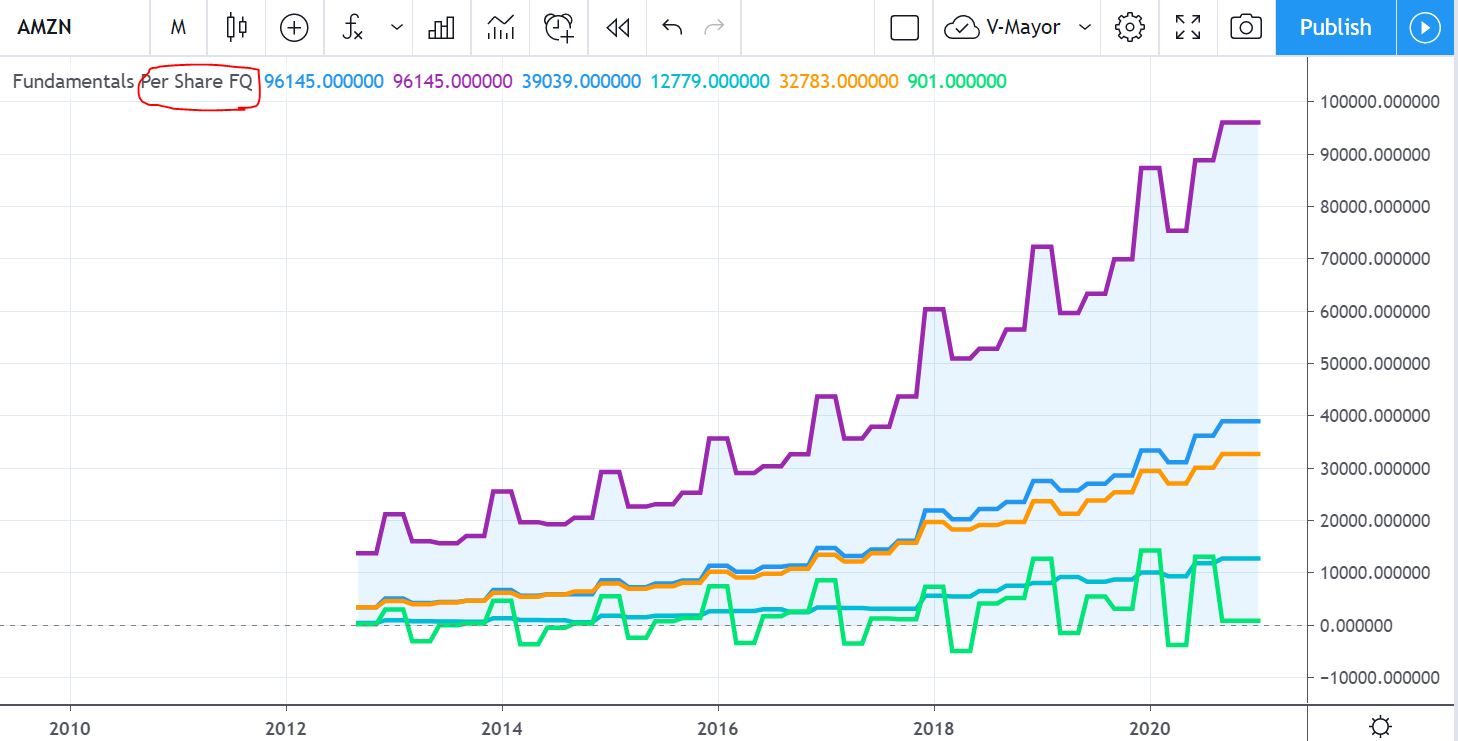
Un ejemplo del gráfico «Ingresos y ganancias» (valores en millones):
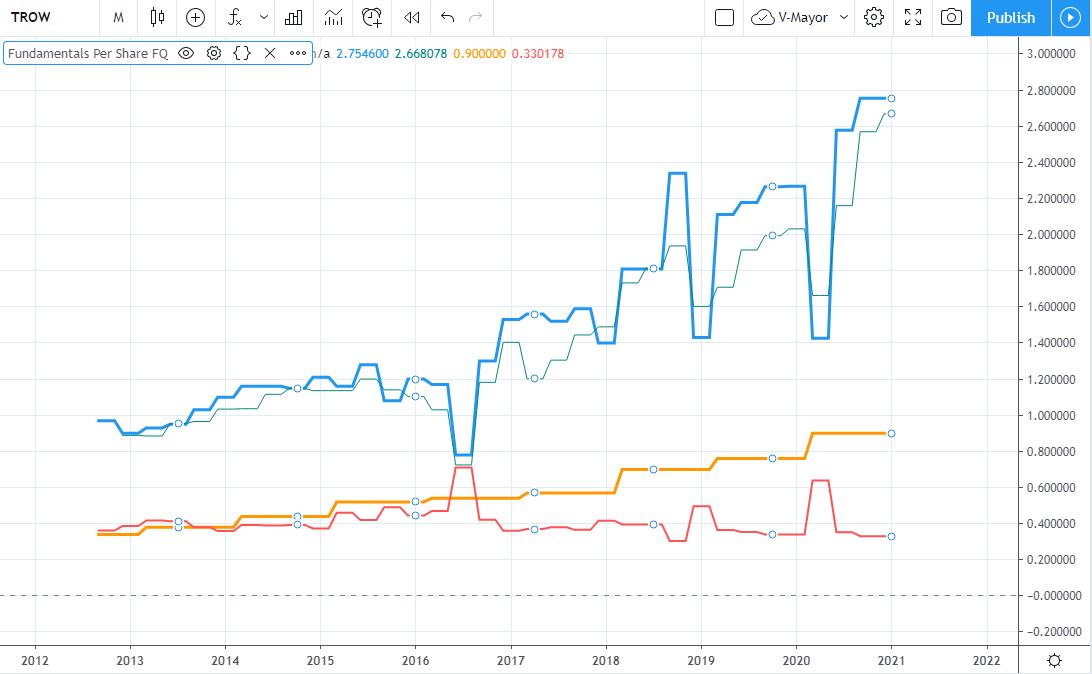
Un ejemplo de gráfico «EPS y DPS», que contiene:
- Beneficio por acción básica.
- Estimación de beneficios (para que pueda ver si cumplió con el objetivo, pasó o falló).
- Dividendo por acción.
- Proporción de pago de dividendos (payout).
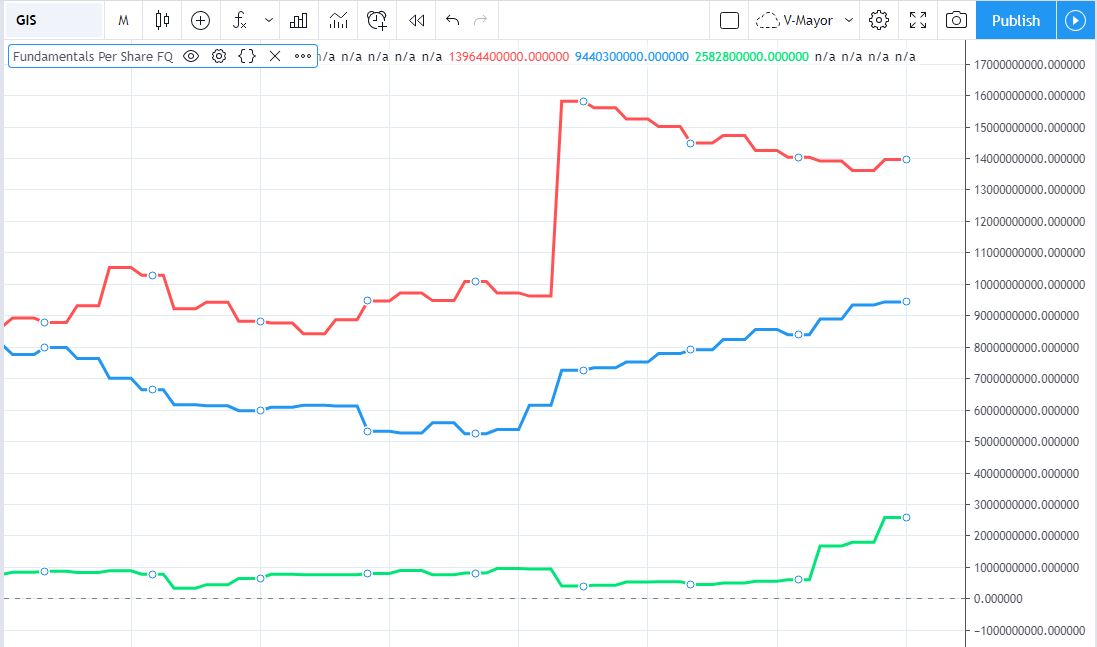
Un ejemplo de deuda, equity y Flujo libre de caja (valores en millones):
Un ejemplo de lo que he llamado «Rendimientos», es decir, ROE, ROIC, ROA e ingresos de I + D a la proporción:
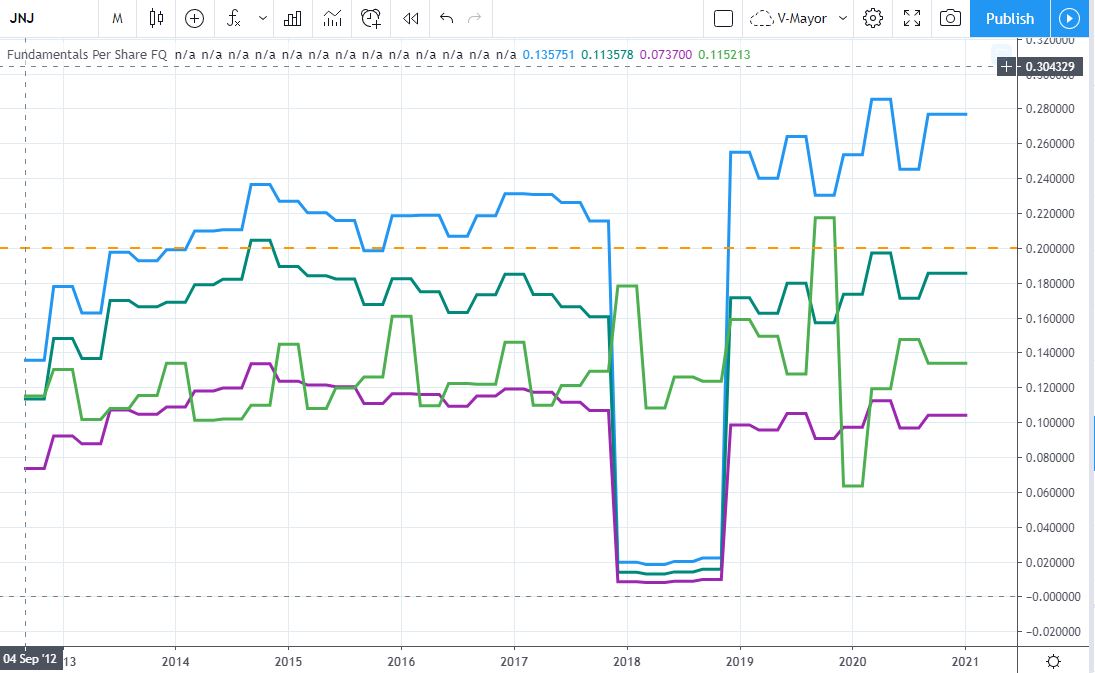
El código
Solo hay que copiar el código en un indicador nuevo de Pine en Tradingview, guardarlo, añadirlo a la pantalla y usarlo. Así de sencillo.
// Este código fuente está sujeto a los términos de la Licencia pública de Mozilla 2.0 en https://mozilla.org/MPL/2.0/
// © @joapen www.joapen.com

// @ versión = 4
estudio ("P1 Fundamentals", shorttitle = "Fundamentals", precisión = 6, overlay = false)
CEROLINA = 0
MILLONES = 1000000

// ---------- Entradas
salida = entrada (defval = "Por acción", título = 'Tipo de salida', opciones = ["Por acción", "% de mcap", "Real"])
// seleccionar datos por trimestre fiscal o por año fiscal
period = input (defval = "FQ", title = 'Period', options = ["FQ", "FY"])
// Mostrar etiquetas solo duran hoy
showLabel = year (time) == year (timenow) and month (time) == mes (timenow) y dayofmonth (hora) == dayofmonth (timenow)

// ---------- Inicializaciones de variables
// En caso de que desee agregar más datos, puede ver todos los parámetros disponibles en el enlace de abajo
// https://www.tradingview.com/pine-script-reference/v4/?solution=43000564727#fun_financial

// Historial y análisis de ingresos y ganancias
rev = financial (syminfo.tickerid, "TOTAL_REVENUE", período) / MILLION
GrossProfit = financial (syminfo.tickerid, "GROSS_PROFIT", punto) / MILLION
ebitda = financiero (syminfo.tickerid, "EBITDA", período) / MILLONES
op_expenses = financial (syminfo.tickerid, "OPERATING_EXPENSES", período) / MILLION * -1
fcf = financial (syminfo.tickerid, "FREE_CASH_FLOW", punto) / MILLION

// ¿Enséñalo? luego trazarlo //
showR_E = input (true, title = "¿Mostrar ingresos y ganancias?")
plot (showR_E? rev: na, title = "Ingresos", color = color.blue, linewidth = 3, style = plot.style_area, transp = 90)
plot (showR_E? rev: na, title = "Ingresos", color = color.purple, linewidth = 3, style = plot.style_linebr)
plot (showR_E? GrossProfit: na, title = "Gross Profit", color = color.blue, linewidth = 3, style = plot.style_linebr)
plot (showR_E? ebitda: na, title = "EBITDA", color = color.aqua, linewidth = 3, style = plot.style_linebr)
plot (showR_E? op_expenses: na, title = "Gastos operativos", color = color.orange, linewidth = 3, style = plot.style_linebr)
plot (showR_E? fcf: na, title = "FCF", color = color.lime, linewidth = 3, style = plot.style_linebr)

si (showLabel y showR_E)
label revBox = label.new (x = bar_index, y = rev, text = "Ingresos", textalign = text.align_left, textcolor = color.white, color = color.purple, style = label.style_label_left, size = size.small )
label grossProfitBox = label.new (x = bar_index, y = grossProfit, text = "Gross Profit", textalign = text.align_left, textcolor = color.white, color = color.blue, style = label.style_label_left, size = size. pequeño)
label ebitdaBox = label.new (x = bar_index, y = ebitda, text = "EBITDA", textalign = text.align_left, textcolor = color.black, color = color.aqua, style = label.style_label_left, size = size.small )
label op_expensesBox = label.new (x = bar_index, y = op_expenses, text = "Op. Expenses", textalign = text.align_left, textcolor = color.black, color = color.orange, style = label.style_label_left, size = size .pequeño)
label fcfBox = label.new (x = bar_index, y = fcf, text = "FCF", textalign = text.align_left, textcolor = color.black, color = color.lime, style = label.style_label_left, size = size.small )

// Historial y análisis de EPS y DPS
eps = financial (syminfo.tickerid, "EARNINGS_PER_SHARE_BASIC", punto)
epsE = financial (syminfo.tickerid, "EARNINGS_ESTIMATE", punto)
dps = financial (syminfo.tickerid, "DPS_COMMON_STOCK_PRIM_ISSUE", punto)
dpayout = financial (syminfo.tickerid, "DIVIDEND_PAYOUT_RATIO", punto) / 100

// ¿Enséñalo? luego trazarlo //
showE_D = input (false, title = "¿Mostrar EPS y DPS?")
plot (showE_D? eps: na, title = "EPS", color = color.blue, linewidth = 3, style = plot.style_linebr)
plot (showE_D? epsE: na, title = "EPSE", color = color.teal, linewidth = 1, style = plot.style_linebr)
plot (showE_D? dps: na, title = "DPS", color = color.orange, linewidth = 3, style = plot.style_linebr)
plot (showE_D? dpayout: na, title = "Proporción de pago de dividendos", color = color.red, linewidth = 2, style = plot.style_linebr)

si (showLabel y showE_D)
label epsBox = label.new (x = bar_index, y = eps, text = "EPS", textalign = text.align_left, textcolor = color.white, color = color.blue, style = label.style_label_left, size = size.small )
label epsEBox = label.new (x = bar_index, y = epsE, text = "EPS estimado", textalign = text.align_left, textcolor = color.white, color = color.teal, style = label.style_label_left, size = size. pequeño)
label dpsBox = label.new (x = bar_index, y = dps, text = "DPS", textalign = text.align_left, textcolor = color.black, color = color.orange, style = label.style_label_left, size = size.small )
label dpayoutBox = label.new (x = bar_index, y = dpayout, text = "Div. Payout", textalign = text.align_left, textcolor = color.white, color = color.red, style = label.style_label_left, size = size .pequeño)


// Historial y análisis de deuda a capital
totalDebt = financial (syminfo.tickerid, "TOTAL_DEBT", período) / MILLION
totalEquity = financial (syminfo.tickerid, "TOTAL_EQUITY", período) / MILLION
cash_and_equivalents = financial (syminfo.tickerid, "CASH_N_SHORT_TERM_INVEST", período) / MILLION
// ¿Enséñalo? luego trazarlo //
showDebt = input (false, title = "¿Mostrar deuda?")
plot (showDebt? totalDebt: na, title = "Total Debt", color = color.red, linewidth = 3, style = plot.style_linebr)
plot (showDebt? totalEquity: na, title = "Total Equity", color = color.blue, linewidth = 3, style = plot.style_linebr)
plot (showDebt? cash_and_equivalents: na, title = "cash & equivalents", color = color.lime, linewidth = 3, style = plot.style_linebr)

si (showLabel y showDebt)
label totalDebtBox = label.new (x = bar_index, y = totalDebt, text = "Total Debt", textalign = text.align_left, textcolor = color.white, color = color.red, style = label.style_label_left, size = size. pequeño)
label totalEquityBox = label.new (x = bar_index, y = totalEquity, text = "Total Equity", textalign = text.align_left, textcolor = color.white, color = color.blue, style = label.style_label_left, size = size. pequeño)
label cash_and_equivalentsBox = label.new (x = bar_index, y = cash_and_equivalents, text = "Efectivo y equivalentes", textalign = text.align_left, textcolor = color.white, color = color.lime, style = label.style_label_left, size = size .pequeño)

// Historial y análisis de devoluciones
roe = financial (syminfo.tickerid, "RETURN_ON_EQUITY", punto) / 100
roic = financial (syminfo.tickerid, "RETURN_ON_INVESTED_CAPITAL", punto) / 100
roa = financial (syminfo.tickerid, "RETURN_ON_ASSETS", punto) / 100
RandDtoRevenueRatio = financial (syminfo.tickerid, "RESEARCH_AND_DEVELOP_TO_REVENUE", punto) / 100

// ¿Enséñalo? luego trazarlo //
showReturn = input (false, title = "¿Mostrar devoluciones?")
plot (showReturn? roe: na, title = "ROE", color = color.blue, linewidth = 3, style = plot.style_linebr)
plot (showReturn? roic: na, title = "ROIC", color = color.teal, linewidth = 3, style = plot.style_linebr)
plot (showReturn? roa: na, title = "ROA", color = color.purple, linewidth = 3, style = plot.style_linebr)
plot (showReturn? RandDtoRevenueRatio: na, title = "Relación entre ingresos de I + D", color = color.green, linewidth = 3, style = plot.style_linebr)
hline (showReturn? 0.2: na, color = color.orange, linewidth = 2)

if (showLabel y showReturn)
label roeBox = label.new (x = bar_index, y = roe, text = "ROE", textalign = text.align_left, textcolor = color.white, color = color.blue, style = label.style_label_left, size = size.small )
label roicBox = label.new (x = bar_index, y = roic, text = "ROIC", textalign = text.align_left, textcolor = color.white, color = color.teal, style = label.style_label_left, size = size.small )
label roaBox = label.new (x = bar_index, y = roa, text = "ROA", textalign = text.align_left, textcolor = color.white, color = color.purple, style = label.style_label_left, size = size.small )
label RandDtoRevenueRatioBox = label.new (x = bar_index, y = RandDtoRevenueRatio, text = "R&D to Revenue Ratio", textalign = text.align_left, textcolor = color.white, color = color.green, style = label.style_label_left, size = talla pequeña)


hline (ZEROLINA)


1 comentario en «Algunos datos fundamentales en Tradingview»