I have read a couple of texts related to the simple moving average or rolling average, this one explains the basis and the main values used. I have done some tests and I have compared them to understand the use better.
The different articles always have some tips about this analysis:
- Do not operate based in these signals, use them as control checks.
- During lateral behavior of the market the signs can be false. They work better when there are major changes.
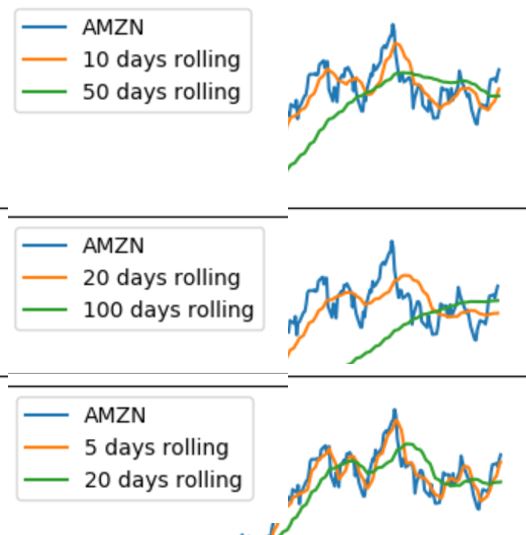
The test below shows the Amazon trend plus rolling average trends with:
- short rolling = 10 days and long rolling 50 days
- short rolling = 20 days and long rolling 100 days
- short rolling = 5 days and long rolling 20 days
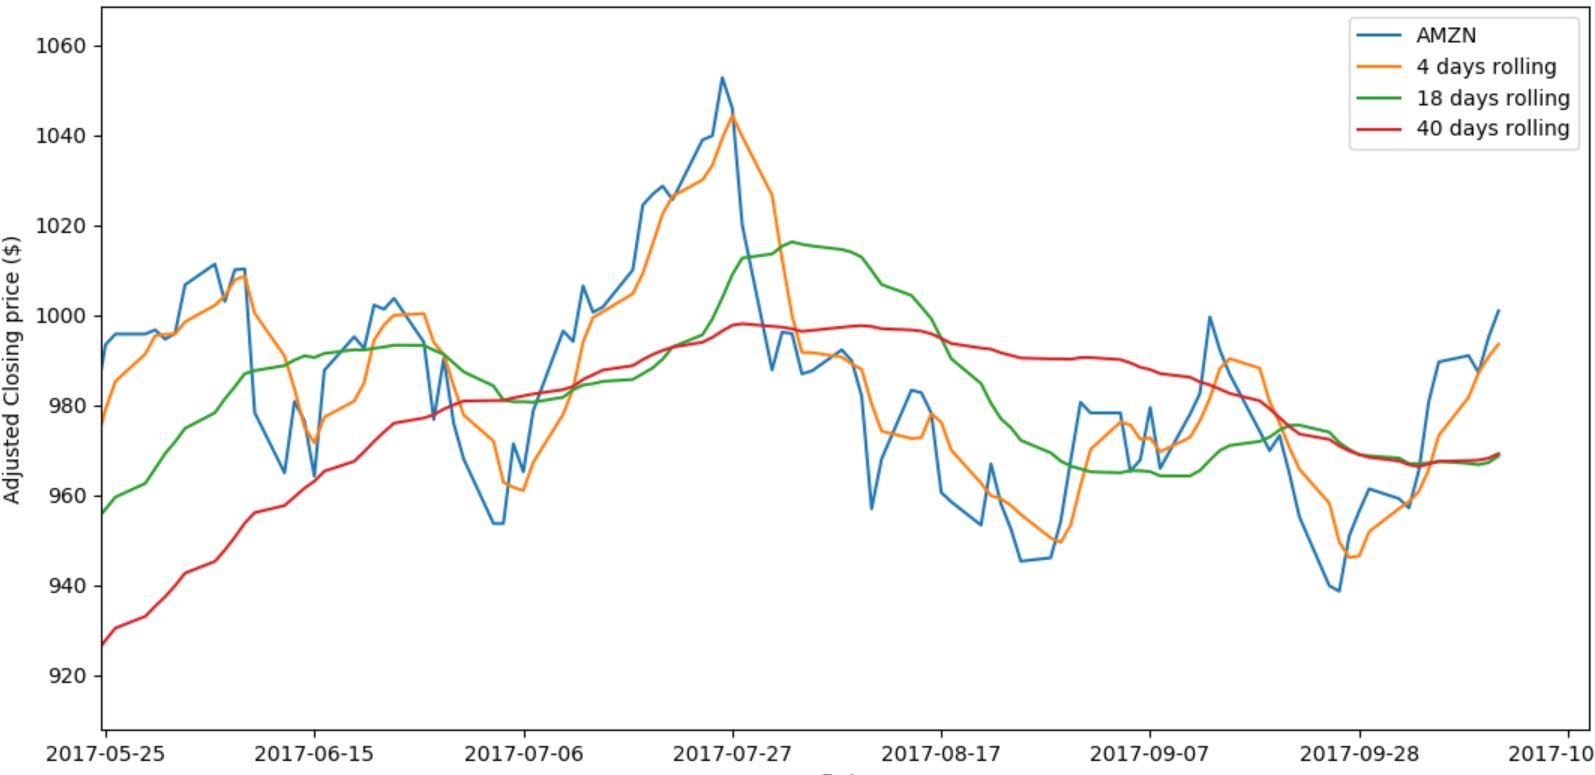
 There is a concept where 3 lines are drawn, that is called the triple crossing, where:
- Short rolling 4 days,
- Medium rolling 18 days
- Long rolling 40 days.
This typically happens when a lateral behavior has finished and this is making a lot of investors to go with the flow.
 For general understanding of which moving average you should use as guide:
- 5 days: For the hyper trader. This shorter the SMA the more signals you will receive when trading. The best way to use a 5-SMA is as a trade trigger in conjunction with a longer SMA period.
- 10 days: popular with the short-term traders; great for swing traders and day traders.
- 20 days: the last stop on the bus for short-term traders. Beyond 20-SMA you are basically looking at primary trends.
- 50 days: used by traders to gauge mid-term trends.
- 200 days: welcome to the world of long-term trend followers. Most investors will look for a cross above or below this average to represent if the stock is in a bullish or bearish trend.