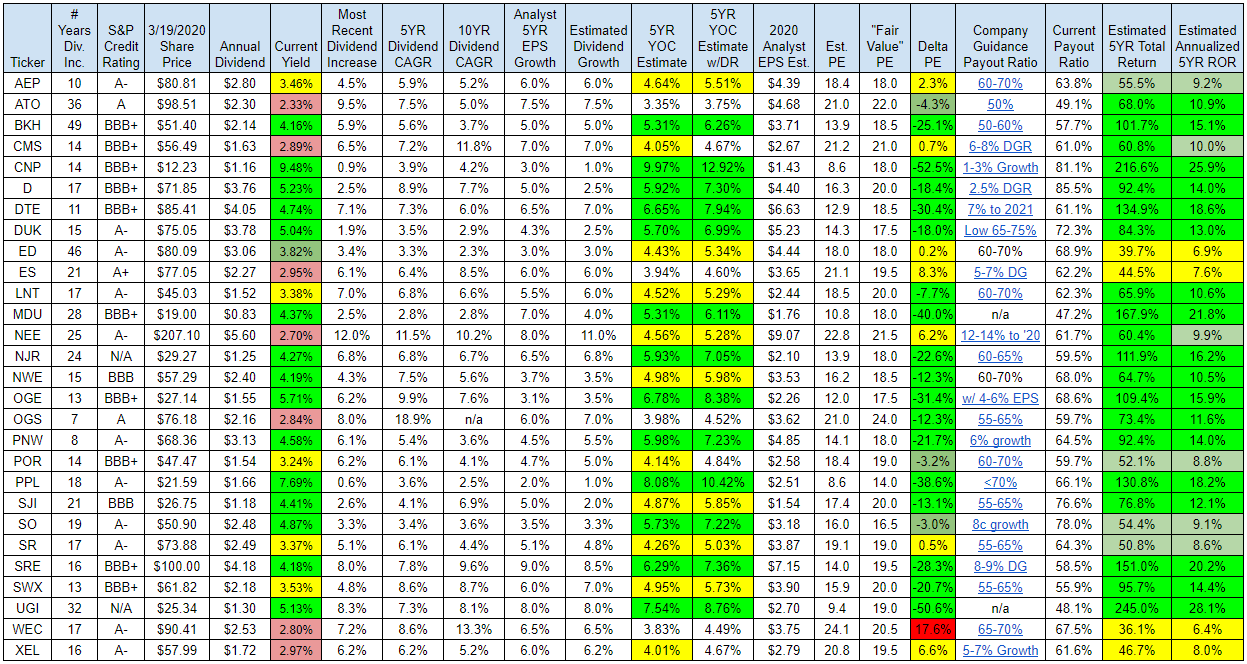
This article, titled as “Top 10 Utility Stocks For Dividend Growth And Income”, show a table with data of the selected companies. The analysis is very rich and didactic about the data he collects and how he assess it.
To me this table is very good summary. I was thinking about how to retrieve data from different list of companies and have a quick look on dividend growth indicators in a semi-automatic way.
So, how could I do it?
Sources of data
Google Sheets enables you to retrieve data from their page with a nice set of formulas, it’s very easy to retrieve data, the problem is that the amount of data is very limited.
Then I went to https://www.finviz.com/ and I discovered that you can take all different parameters of a given company.
Last but not least, I missed some data, so I went to yahoo finance and I got what I missed.
The sheet
I have build a sheet that tries to:
- Build quickly a numeric analysis of a list of companies (as in this example utilities companies).
- Be able to define the data I want to analyze using the map of finviz.com and other related data from yahoo finance.
- Be able to adequate 5 – 8 indicators oriented to whatever you want to analyze: fundamental analysis on growth, technical analysis, fundamental analysis on revenue and gross margin…
The outcome
This google sheets document contains the analysis I did on the same list of utilities companies.
It’s not as complete and professional analysis as the one done by Eric Landis, but it’s a quick way to discard companies and then focus on a short list.
Things to improve
Some of the parameters do not refresh always in the right way, so from time to time you have to review the tables where the data come from: specially from yahoo finance.
