Background
I have the purpose of counting US drilling rigs that are producing oil. I understand so many of them are closing and the cost to re-open them should be considerable. With the amount of oil in the market and the future prices sinking into even negative values, I want to challenge my self if I can improve the way to analyze and predict when the barrel price is going to bull again.
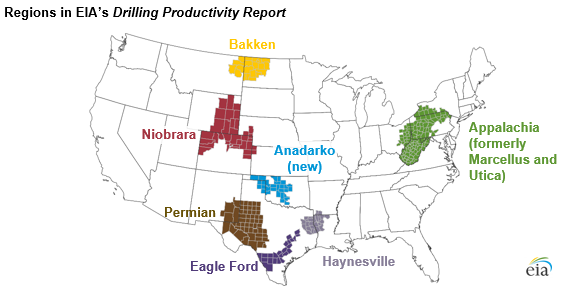
US drilling regions
These are the main drilling regions in US.
- Permian
- Anakardo,
- Appalachia,
- Niobrara
- Eagle Ford
- Haynesville
- Bakken
Sources of data
I only found a place that offers directly the number of opened drilling rigs in a chart. And it’s just for Oklahoma (Anakardo). It’s this one: https://ycharts.com/indicators/oklahoma_inland_rotary_rigs
Some other sources:
- List from TCI Business Capital: it only provides data from time to time.
- List from North Dakota: just for this region, which belongs to Bakken region.
- US Energy Information Administration (EIA): https://www.eia.gov/dnav/ng/ng_enr_drill_s1_m.htm
- Quandl.com: it has no data on active drilling rigs.
to do: find more data.