I have been attending this workshop and I would like to keep these notes, tables and diagrams.
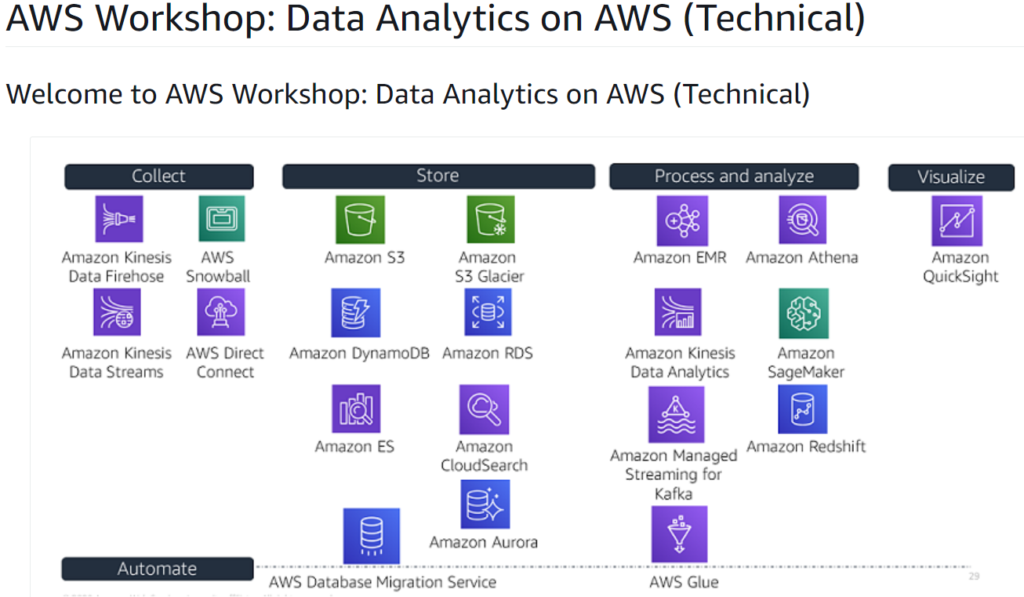
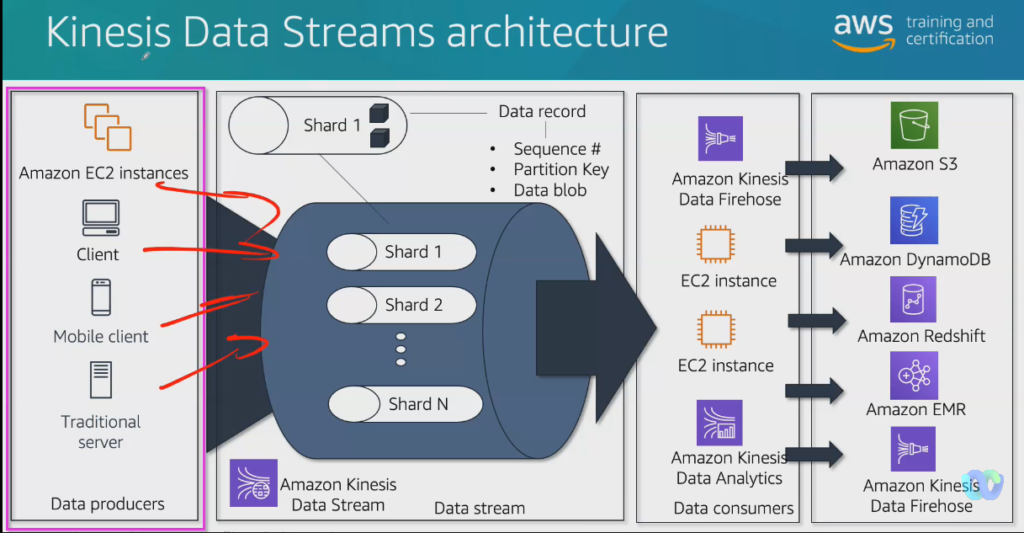
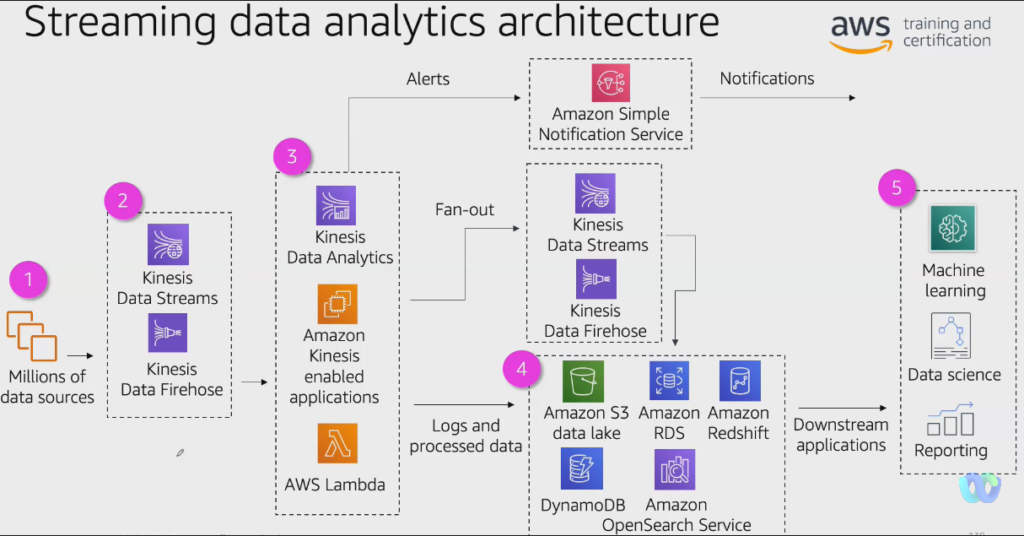
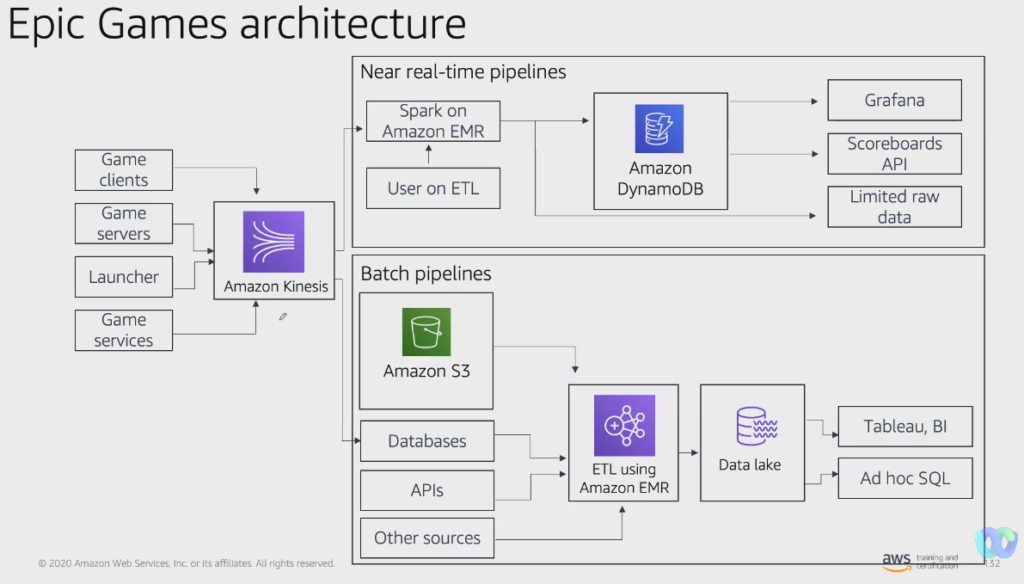
Kinesis
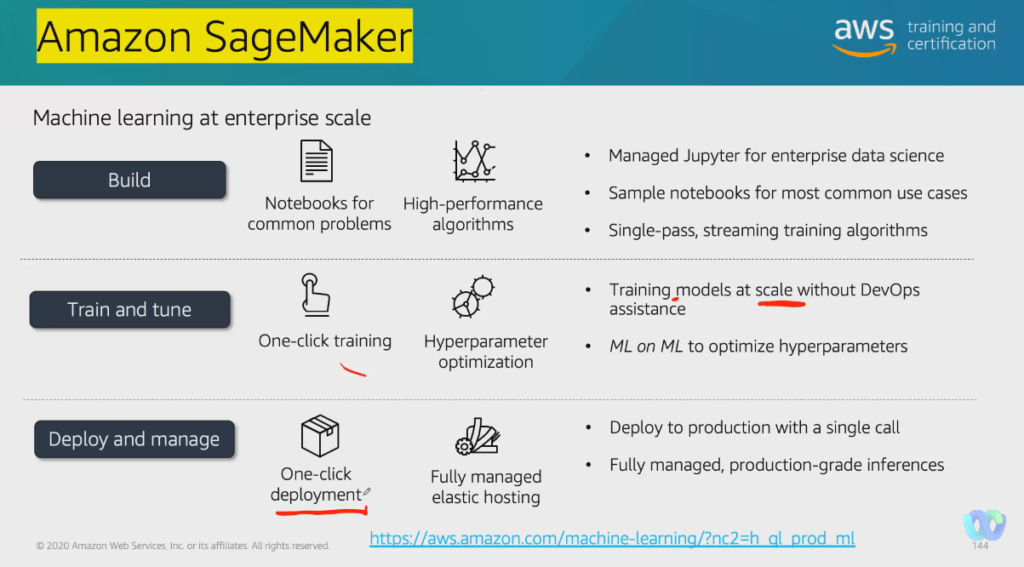
SageMaker
Exercises
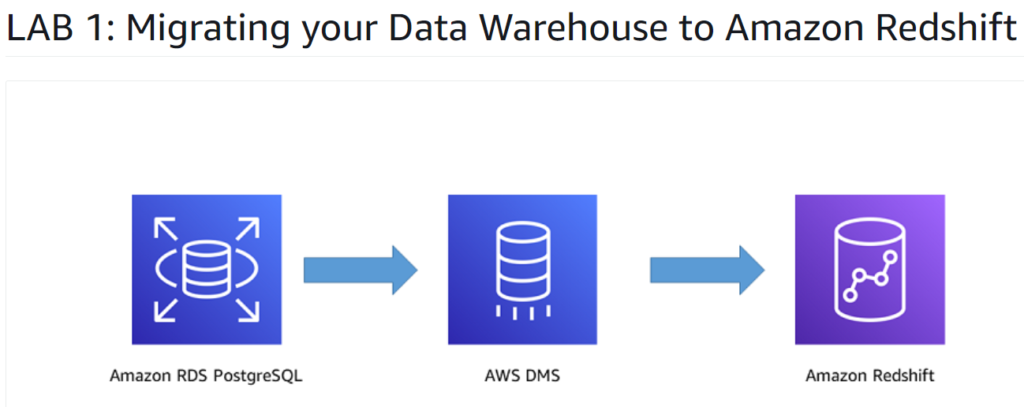
You can see here the 3 labs.
- Lab 1: migrate the database to Amazon Redshift with the support of DMS.
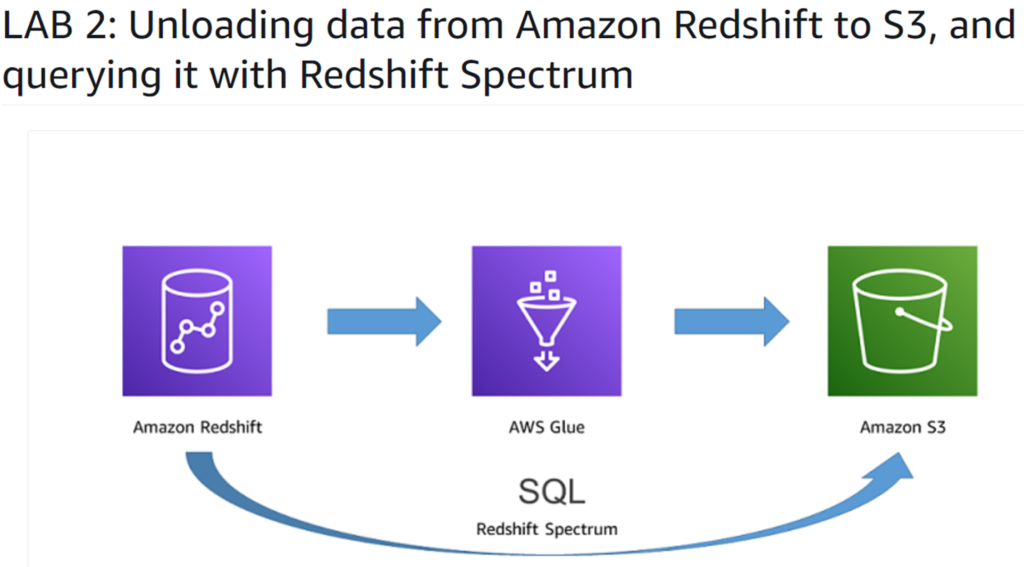
- Lab 2: Unload the Redshift database to S3 (datalake) and use a Redshift Spectrum Query to reach all data. Check the time responses in comparison to the initial queries done on the database.
- Lab3: Create a VPN connection to Redshift and connect QuickSight to build 4 charts.