It is the first time that I have a situation like this while studying indicators like these ones, so I am going to document what is going on.
The starting snapshot
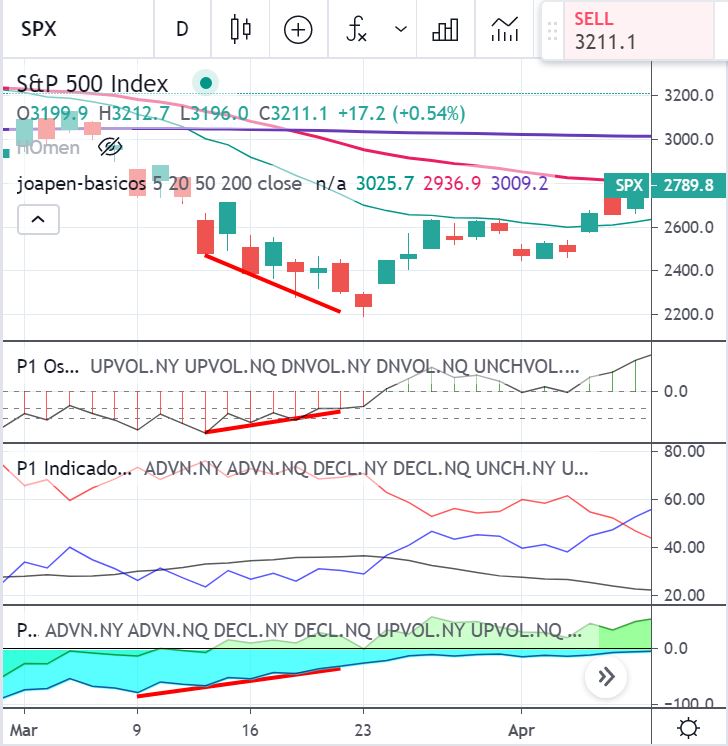
4 weeks after the historical highest SPX when was at 3400 points this is what happens.
 Initial view
- The McClellan oscillator seems to decrease the fall, in theory it begins to draw a divergence, which to me it still needs a few days to confirm.
- The “strong hand” sales volume is supposed to be decreasing, but the SPX is still down.
Things to watch:
- The US senate, congress and the FED agree;
- the impact of the COVID-19 in US.
Update 08/April/2020
- SPX climbed from 2250 to 2789.
- McClellan turned green, but ADX is still not on a positive trend.
- Big buyers are still selling.
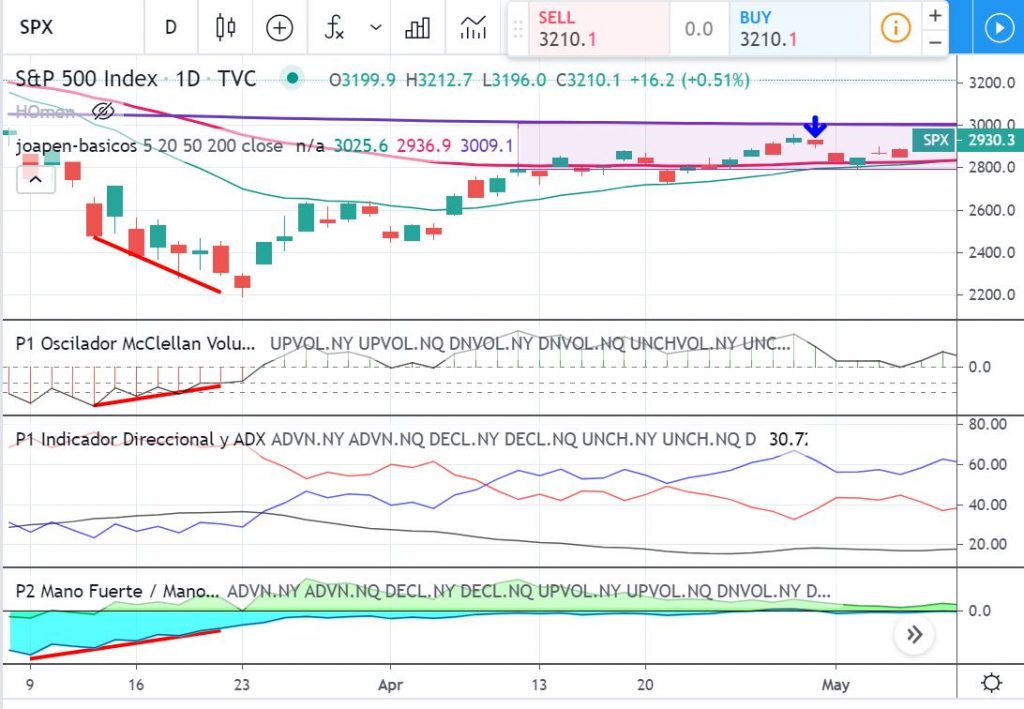
Update on 08/May/2020
- A channel has been build between 2800 and 3000
- ADX is positive and McClellan keeps being green.
- Buy buyers are still selling, but closed to the buy line.
- Fed continues sending money to the market, it’s incredible.
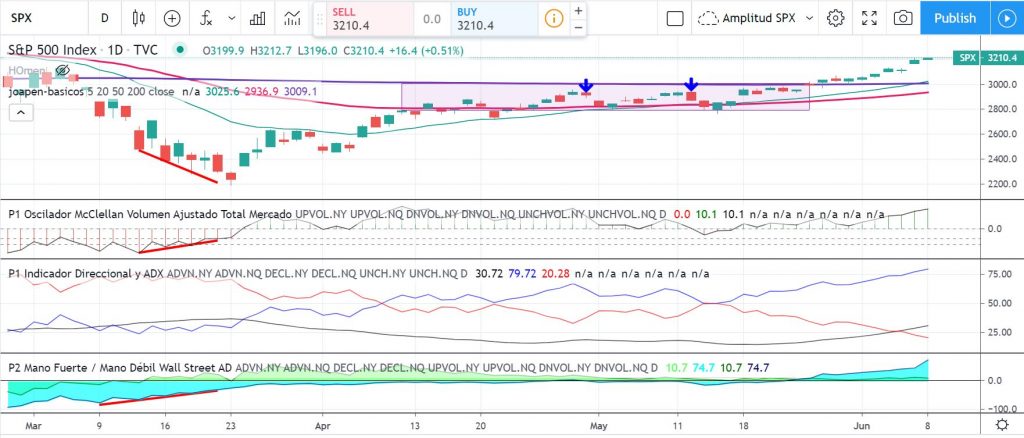
Update on 08/June/2020
- Market flying since May 27th over 3000. It’s when big buyers started to buy strongly.
- All green.
- Fed continues sending money to the market.
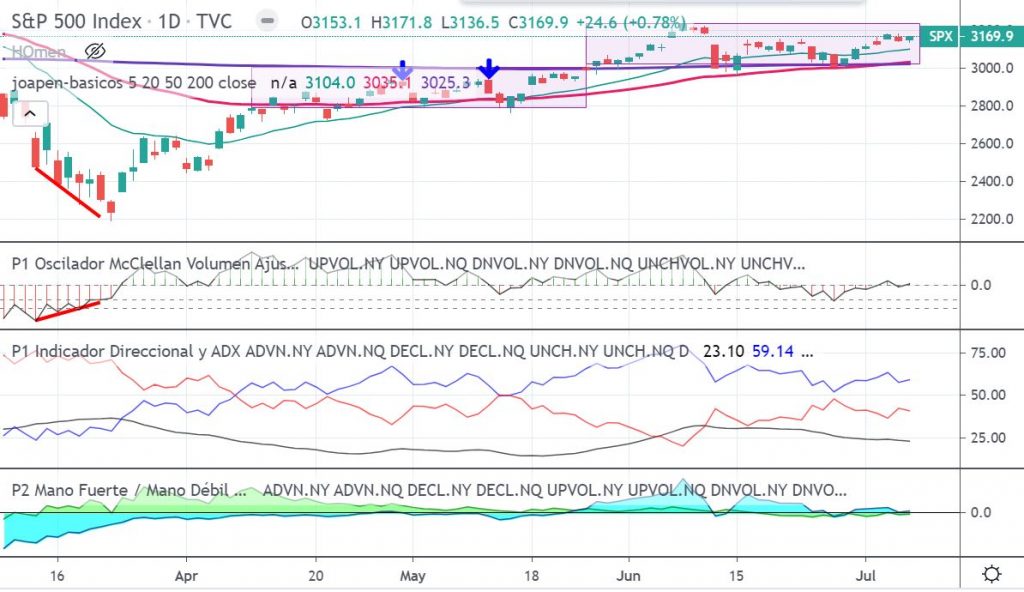
Update on 08/July/2020
- Now a channel between 3000-3150 is build.
- McClellan always around zero and red is predominant.
- Market breadth is still positive, no news.
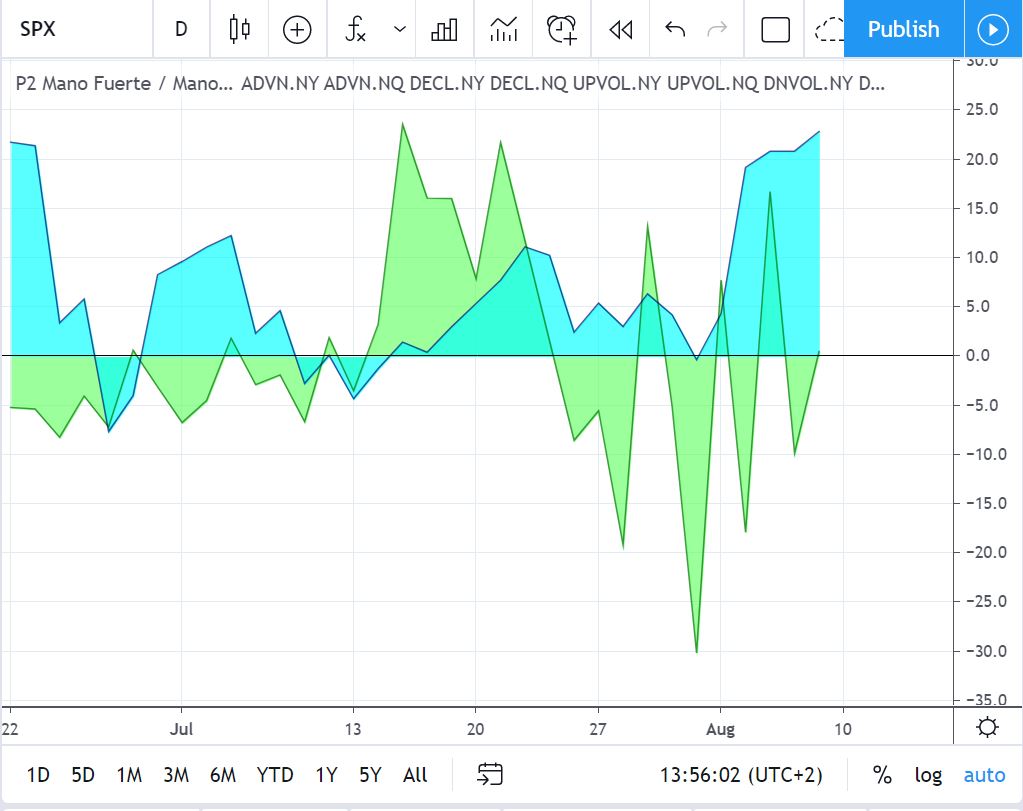
Update on 08/August/2020
- The channel between 3000-3200 has been passed and now is over it.
- McClellan always around zero and red is predominant.
- Market breadth is still positive, no news.
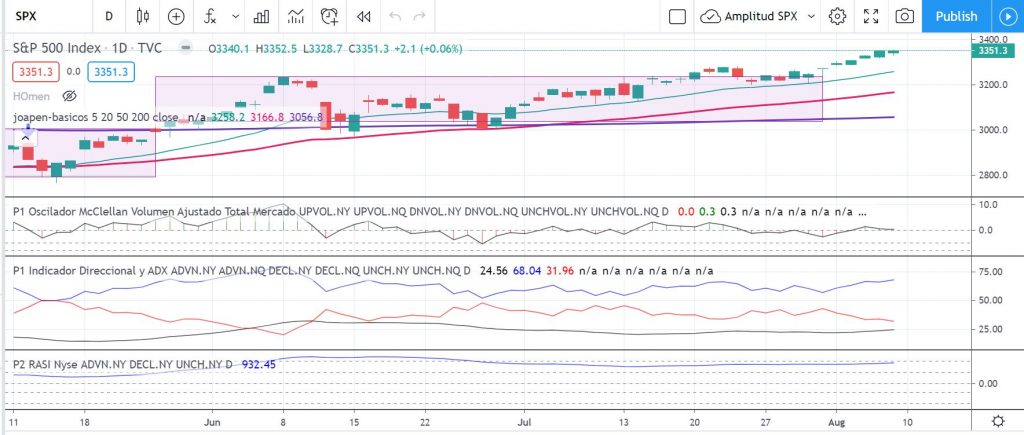
Big buyers are buying consistenly: