Abstract
In his book “Mastering the trade”, John Carter proposes a simple system based on the moving averages of 8 and 21.
I have implemented the basis of this system and I have changed some behaviors:
- I added the Squeeze momentum indicator to filter the positive trend and reduce the draw downs.
- I have not added any stop-loss.
I have build this system on Tradingview and I have done some back-testing in 3 periods to see how it works.
The system
The system code is this one:

// This source code is subject to the terms of the Mozilla Public License 2.0 at https://mozilla.org/MPL/2.0/
// © joapen

//@version=4
strategy("Carter EMA(8/21)", overlay=true)

// === BACKTEST RANGE ===
FromMonth = input(defval = 1, title = "From Month", minval = 1)
FromDay   = input(defval = 1, title = "From Day", minval = 1)
FromYear  = input(defval = 2020, title = "From Year", minval = 2000)
ToMonth   = input(defval = 12, title = "To Month", maxval = 12)
ToDay     = input(defval = 31, title = "To Day", maxval = 31)
ToYear    = input(defval = 2020, title = "To Year", maxval = 2020)

//
// SQZMOM
//
length = input(14, title="BB Length")
mult = input(2.0,title="BB MultFactor")
lengthKC=input(20, title="KC Length")
multKC = input(1.5, title="KC MultFactor")

useTrueRange = input(true, title="Use TrueRange (KC)", type=input.bool)

// Calculate BB
source = close
basis = sma(source, length)
dev = multKC * stdev(source, length)
upperBB = basis + dev
lowerBB = basis - dev

// Calculate KC
ma = sma(source, lengthKC)
range = useTrueRange ? tr : (high - low)
rangema = sma(range, lengthKC)
upperKC = ma + rangema * multKC
lowerKC = ma - rangema * multKC

sqzOn  = (lowerBB > lowerKC) and (upperBB < upperKC)
sqzOff = (lowerBB < lowerKC) and (upperBB > upperKC)
noSqz  = (sqzOn == false) and (sqzOff == false)

val = linreg(source  -  avg(avg(highest(high, lengthKC), lowest(low, lengthKC)),sma(close,lengthKC)), lengthKC,0)

// lime green  red marron
sqzLong = iff( val > 0, iff( val > nz(val[1]), true, false), iff( val < nz(val[1]), false, true))
// Plots
plot(upperBB, title="BB", color=color.green)
plot(ema(close,8), title="EMA(8)", color=color.orange)
plot(ema(close,21), title="EMA(21)", color=color.red)

longCondition = (ema(close, 8)> sma(close, 21)) and (close < ema(close, 8) and sqzLong) and time > timestamp(FromYear, FromMonth, FromDay, 00, 00) and time < timestamp(ToYear, ToMonth, ToDay, 23, 59)
alertcondition(longCondition, title='Long', message='long!!!')
if (longCondition)
    strategy.entry("My Long Entry Id", strategy.long)

shortCondition = (close > upperBB ) or (ema(close, 8)< sma(close, 21) or val<0) and time < timestamp(ToYear, ToMonth, ToDay, 23, 59)
alertcondition(shortCondition, title='Short', message='short!!!')
if (shortCondition)
    strategy.entry("My Short Entry Id", strategy.short)
Back-testing conditions
- Amount = 100.000$
- Commission = 0$
- List of companies: fix list of companies I know with different behaviors, volatility and industries: BEN, TROW, CTVA, AEMD, GMRE, WBA, CVS, MO, DT, GE.
Quality of the samples:
- Minimum around 200 trades to consider a good amount of cases.
- Share Ratio > 1
- Profit Factor > 2
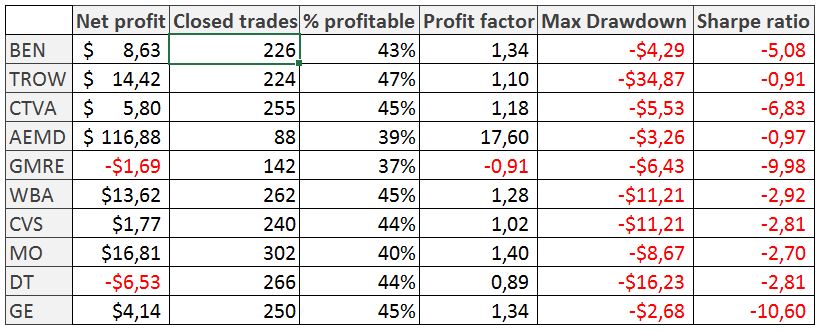
Back-testing results for first date range
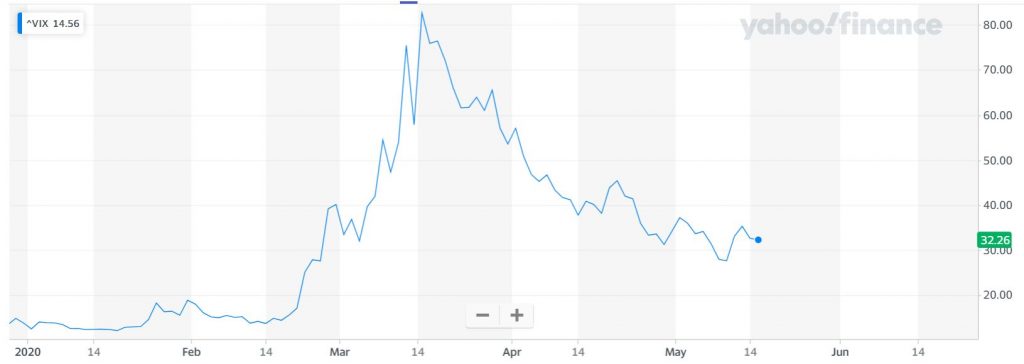
- Date range = 1/1/2020 – 13/05/2020
- Time frame = 5 minutes
Volatility during this period have been so high:
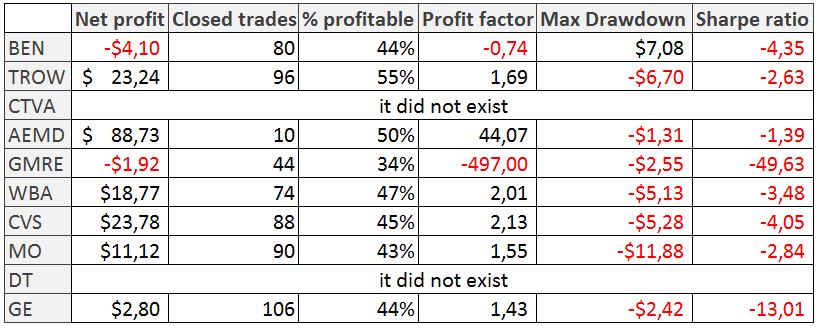
Back-testing results for second date range
- Date range = 1/1/2019 – 13/05/2019
- Time frame = 15 minutes (Tradingview does not enable me to do it in 5 minutes)
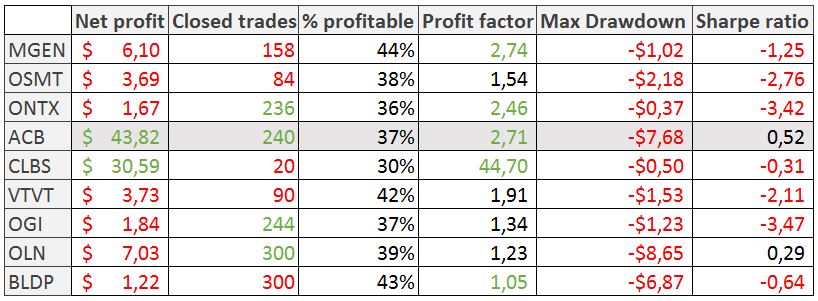
Back-testing results for bio companies in 2020
- Date range = 1/1/2020 – 13/05/2020
- Time frame = 5 minutes
Conclusions
15/05/2020
- I have to improve or discard this system.
- Check when the market trend is better.
- Check when volatility is lower.