The strategy I’m using is very popular and extended. So many people knows it and therea re thousand of variances to the main one. Surprisingly it still works.
The name I gave to this strategy is “bb-rsi-cmf” and comes from the 3 indicators I’m using to work on it.
These indicators are:
- Trend indicator = Bollinger bands.
- Momentum indicator = RSI.
- Volume indicator = Chaikin Money flow (confirm with japanese candles).
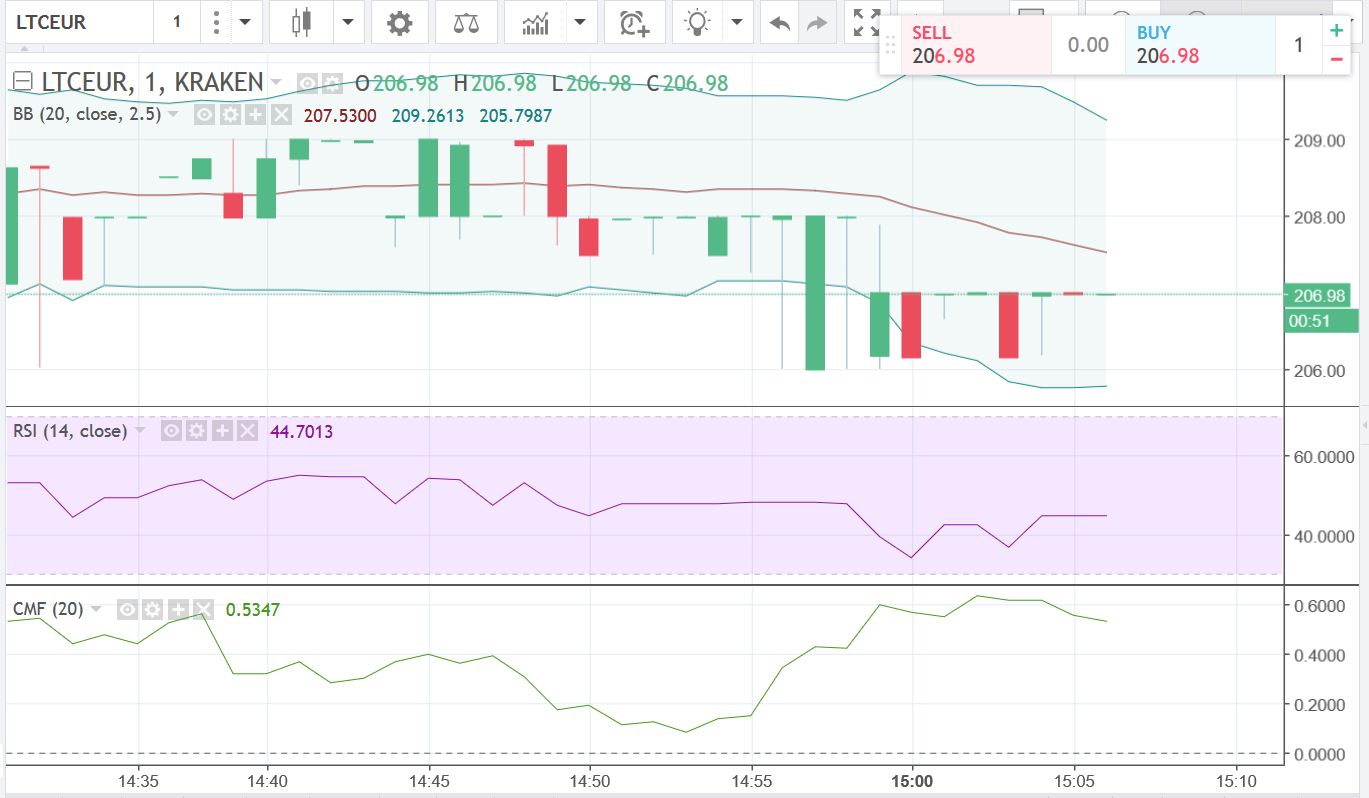 Configuration of the indicators in Trading View
The configuration of the Bollinger Bands in Tradingview can be adjusted, especially for the standard deviation that by default is 2. I have adjusted to 2.5 to increase accuracy.
From the Wikipedia about StdDev:
- For the normal distribution, this includes 68.27% of the numbers;
- 2 standard deviations from the mean include 95.45%;
- 3 standard deviations from the mean include 99.73%;
- 4 standard deviations from the mean include 99.994%.
The configuration of the Chaikin Money Flow (CMF) indicator just have a parameter: Lenght. It indicates the time period to be used in calculating Chaikin Money Flow (I keep the default value = 20).
The configuration of RSI have a couple of parameters:
- Length: The time period to be used in calculating the RSI. 14 days is the default.
- Source: Determines what data from each bar will be used in calculations. “Close” is the default.
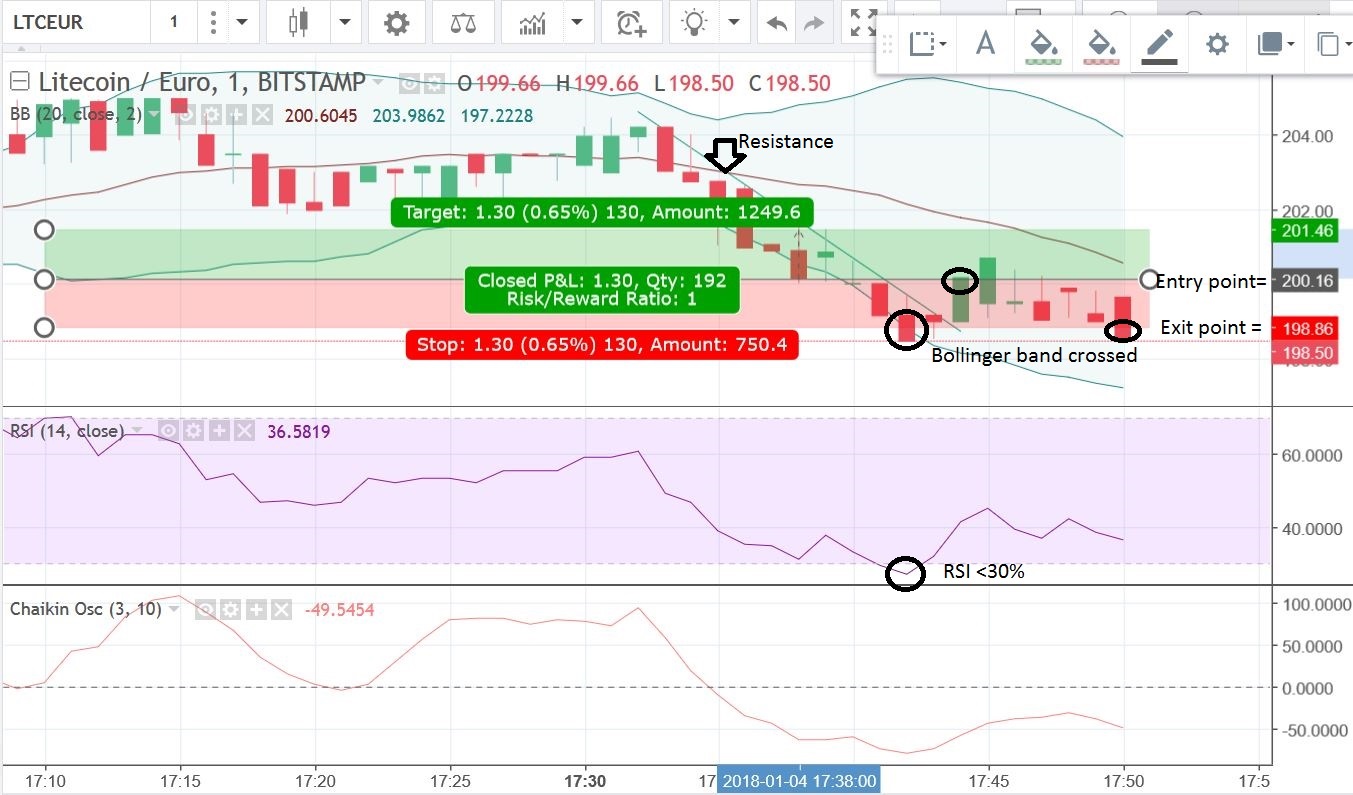
Entry criteria:
- Wait for the candle to pass the low bollinger band. On this event,
- Check that RSI < 30%, or close to it.
- Check that Chaikin Money Flow has enough volume.
- If so, go to next step.
- Draw the resistances using the red candles taking the ones that are higher.
- Wait till the value cross the resistance line. It’s better when the cross is done by a green candle. Open the position at this point (this action requires you a quick reaction).
- Define the exit point and the stop loss.
Exit criteria
- Define the stop loss (1%).
- Define the exit point (2%).
- Close the position when some of the events happen.
During the position is opened
- Pay attention to the way the value is moving.
- Check the volume of activity in the table of prices.
- Check if RSI rises above 70%. This means the market is overboughting (good!).
- If the value goes up, move the stop-loss up, (ideally turn the stop-loss into a stop-win).
First try, Lose.
This picture below shows the first try I did on this strategy, the result: lose 1%.
 Chaikin Money Flow behavior
When Chaikin Money Flow crosses the Zero Line, this can be an indication that there is an impending trend reversal.
- Bullish Crosses occur when Chaikin Money Flow crosses from below the Zero Line to above the Zero Line. Price then falls.
- Bearish Crosses occur when Chaikin Money Flow crosses from above the Zero Line to below the Zero Line. Price then rises.
It should be noted that brief crosses can occur resulting in false signals. The best way to avoid these false signals is by examining past performance for the particular security that is being analyzed and even adjusting the thresholds accordingly. For example, instead of a Zero Line Cross, a technical analyst may use two separate lines such as .05 and -.05.