This is the first code I have created to show financial information of companies on Tradingview. This helps you to review the fundamental basis of a company through the time.
To start with something basic I have entered just some data: revenue, gross profit, operating income, EBITDA, and free cashflow.
This link contains the financial data you can use on PINE.
Video
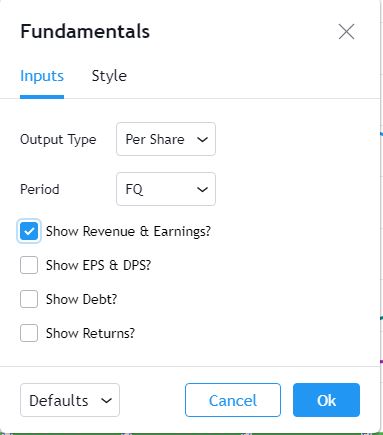
What can you check on the selection pane?
On “period”, you can show the data related to:
- the fiscal quarters
- or the fiscal years.
You can select a pack of financial data that I have organized in sections:
- Revenue & earnings
- EPS & DPS (EPS, EPS estimate, DPS and dividend payout ratio )
- Debt (total debt, total equity and cash & equivalents)
- Returns (ROE, ROIC, ROA and R&D revenue to ratio)
. I recommend to just select one of them, in other case the chart is a mess.

Let’s see some screenshots
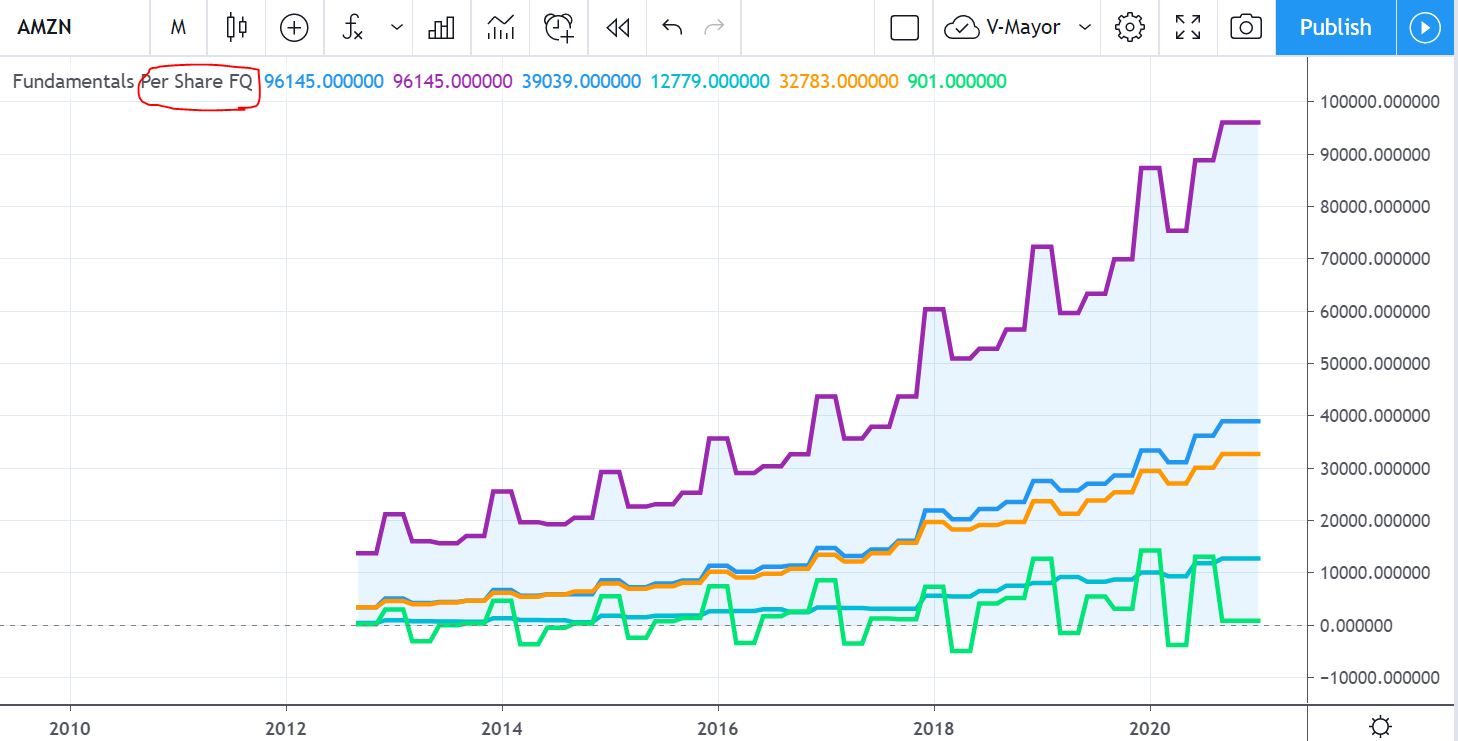
An example of the “Revenue & Earnings” chart (values in millions):
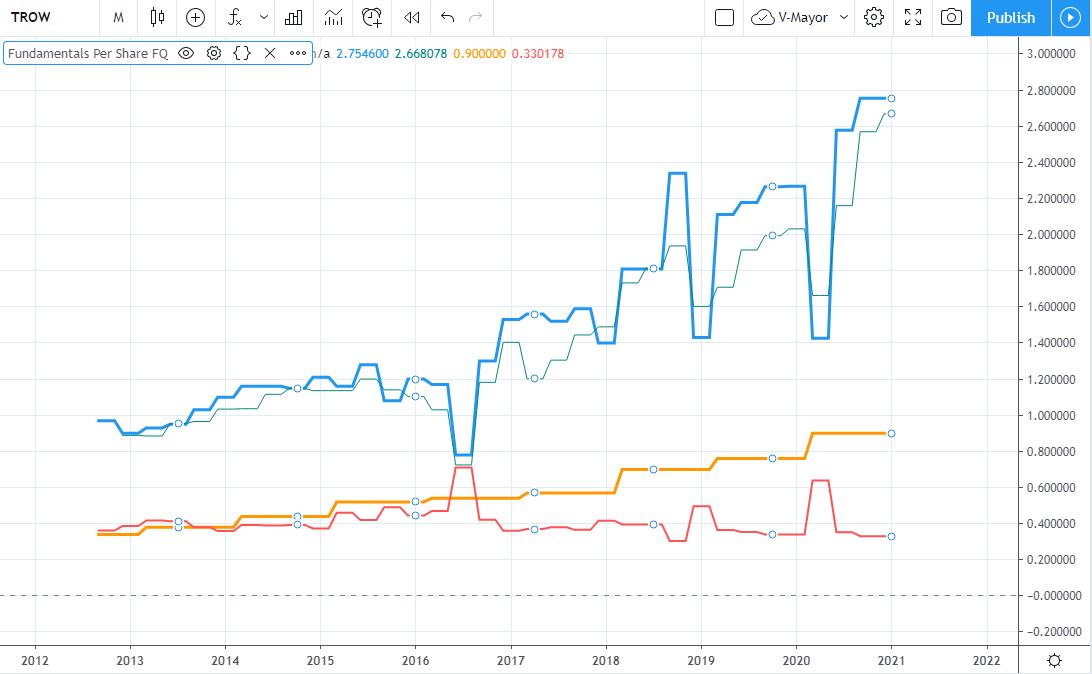
An example of “EPS & DPS” chart, than contains:
- Earning per share basic
- Earning estimate (so you can see if the met the target, passed or missed).
- Dividend per share.
- Dividend payout ratio.
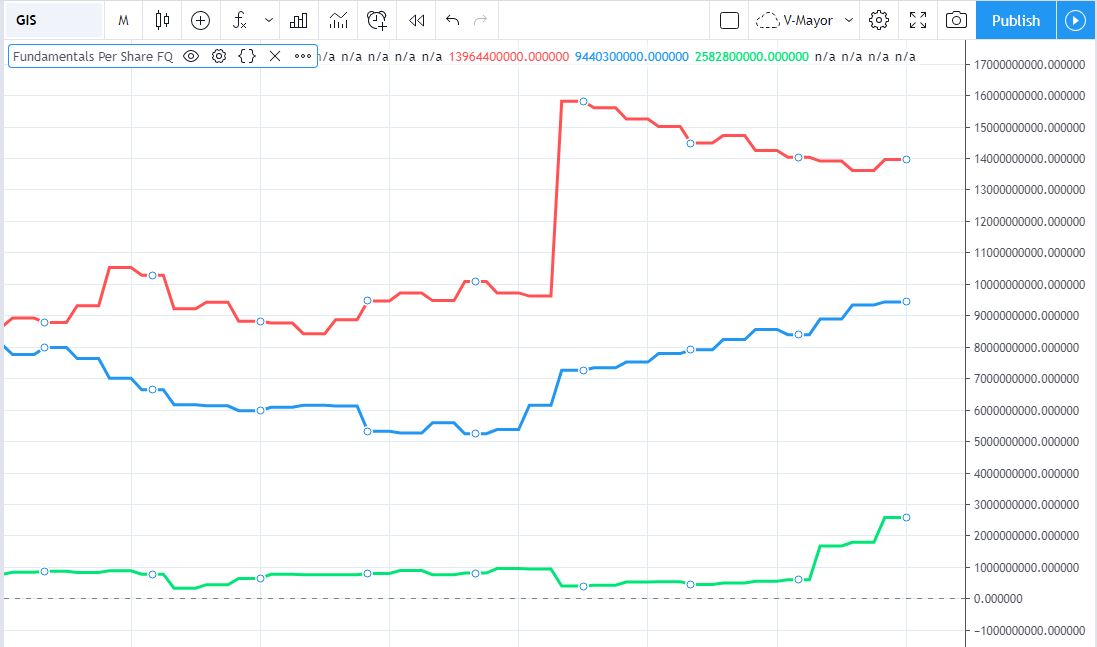
An example of debt and equities (values in millions):
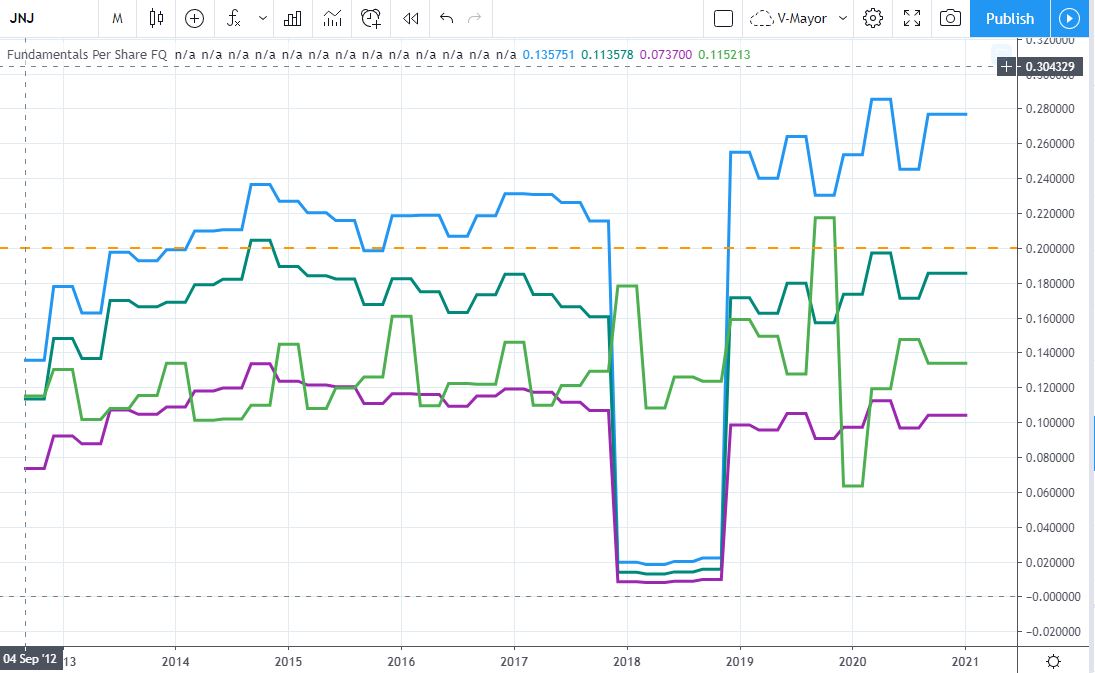
An example of what I have called “Returns”, that is ROE, ROIC, ROA and R&D revenue to ratio:
The code
It’s very easy to take this code and create an indicator in Pine section of TradingView.
// This source code is subject to the terms of the Mozilla Public License 2.0 at https://mozilla.org/MPL/2.0/
// © @joapen www.joapen.com

//@version=4
study("P1 Fundamentals", shorttitle="Fundamentals", precision=6, overlay=false)
ZEROLINE = 0
MILLION = 1000000

// ---------- Inputs
output = input(defval="Per Share", title='Output type', options=["Per Share", "% of mcap", "Actual"])
// select data by fiscal quarter or by fiscal year
period = input(defval="FQ", title='Period', options=["FQ", "FY"])
// Show labels only last today
showLabel = year(time) == year(timenow) and month(time) == month(timenow) and dayofmonth(time) == dayofmonth(timenow)

// ---------- Variable initializations
// In case you want to add more data you can see all parameters available on the link below
// https://www.tradingview.com/pine-script-reference/v4/?solution=43000564727#fun_financial

// Revenue and Earnings History and Analysis
rev = financial(syminfo.tickerid, "TOTAL_REVENUE", period) / MILLION
grossProfit = financial(syminfo.tickerid, "GROSS_PROFIT", period) / MILLION
ebitda = financial(syminfo.tickerid, "EBITDA", period) / MILLION
op_expenses = financial(syminfo.tickerid, "OPERATING_EXPENSES", period) / MILLION * -1
fcf = financial(syminfo.tickerid, "FREE_CASH_FLOW", period) / MILLION

// Show it? then plot it //
showR_E = input(true, title = "Show Revenue & Earnings?")
plot(showR_E?rev:na, title="Revenue", color=color.blue, linewidth=3, style=plot.style_area, transp=90)
plot(showR_E?rev:na, title="Revenue", color=color.purple, linewidth=3, style=plot.style_linebr)
plot(showR_E?grossProfit:na, title="Gross Profit", color=color.blue, linewidth=3, style=plot.style_linebr)
plot(showR_E?ebitda:na, title="EBITDA", color=color.aqua, linewidth=3, style=plot.style_linebr)
plot(showR_E?op_expenses:na, title="Operating Expenses", color=color.orange, linewidth=3, style=plot.style_linebr)
plot(showR_E?fcf:na, title="FCF", color=color.lime, linewidth=3, style=plot.style_linebr)

if (showLabel and showR_E)
label revBox = label.new(x=bar_index, y=rev, text="Revenue", textalign=text.align_left, textcolor=color.white, color=color.purple, style=label.style_label_left, size=size.small)
label grossProfitBox = label.new(x=bar_index, y=grossProfit, text="Gross Profit", textalign=text.align_left, textcolor=color.white, color=color.blue, style=label.style_label_left, size=size.small)
label ebitdaBox = label.new(x=bar_index, y=ebitda, text="EBITDA", textalign=text.align_left, textcolor=color.black, color=color.aqua, style=label.style_label_left, size=size.small)
label op_expensesBox = label.new(x=bar_index, y=op_expenses, text="Op. Expenses", textalign=text.align_left, textcolor=color.black, color=color.orange, style=label.style_label_left, size=size.small)
label fcfBox = label.new(x=bar_index, y=fcf, text="FCF", textalign=text.align_left, textcolor=color.black, color=color.lime, style=label.style_label_left, size=size.small)

// EPS & DPS History and Analysis
eps = financial(syminfo.tickerid, "EARNINGS_PER_SHARE_BASIC", period)
epsE = financial(syminfo.tickerid, "EARNINGS_ESTIMATE", period)
dps = financial(syminfo.tickerid, "DPS_COMMON_STOCK_PRIM_ISSUE", period)
dpayout = financial(syminfo.tickerid, "DIVIDEND_PAYOUT_RATIO", period) / 100

// Show it? then plot it //
showE_D = input(false, title = "Show EPS & DPS?")
plot(showE_D?eps:na, title="EPS", color=color.blue, linewidth=3, style=plot.style_linebr)
plot(showE_D?epsE:na, title="EPSE", color=color.teal, linewidth=1, style=plot.style_linebr)
plot(showE_D?dps:na, title="DPS", color=color.orange, linewidth=3, style=plot.style_linebr)
plot(showE_D?dpayout:na, title="Dividend payout ratio", color=color.red, linewidth=2, style=plot.style_linebr)

if (showLabel and showE_D)
label epsBox = label.new(x=bar_index, y=eps, text="EPS", textalign=text.align_left, textcolor=color.white, color=color.blue, style=label.style_label_left, size=size.small)
label epsEBox = label.new(x=bar_index, y=epsE, text="Estimated EPS", textalign=text.align_left, textcolor=color.white, color=color.teal, style=label.style_label_left, size=size.small)
label dpsBox = label.new(x=bar_index, y=dps, text="DPS", textalign=text.align_left, textcolor=color.black, color=color.orange, style=label.style_label_left, size=size.small)
label dpayoutBox = label.new(x=bar_index, y=dpayout, text="Div. Payout", textalign=text.align_left, textcolor=color.white, color=color.red, style=label.style_label_left, size=size.small)


// Debt to Equity History and Analysis
totalDebt = financial(syminfo.tickerid, "TOTAL_DEBT", period) / MILLION
totalEquity = financial(syminfo.tickerid, "TOTAL_EQUITY", period) / MILLION
cash_and_equivalents = financial(syminfo.tickerid, "CASH_N_SHORT_TERM_INVEST", period) / MILLION
// Show it? then plot it //
showDebt = input(false, title = "Show Debt?")
plot(showDebt?totalDebt:na, title="Total Debt", color=color.red, linewidth=3, style=plot.style_linebr)
plot(showDebt?totalEquity:na, title="Total Equity", color=color.blue, linewidth=3, style=plot.style_linebr)
plot(showDebt?cash_and_equivalents:na, title="cash & equivalents", color=color.lime, linewidth=3, style=plot.style_linebr)

if (showLabel and showDebt)
label totalDebtBox = label.new(x=bar_index, y=totalDebt, text="Total Debt", textalign=text.align_left, textcolor=color.white, color=color.red, style=label.style_label_left, size=size.small)
label totalEquityBox = label.new(x=bar_index, y=totalEquity, text="Total Equity", textalign=text.align_left, textcolor=color.white, color=color.blue, style=label.style_label_left, size=size.small)
label cash_and_equivalentsBox = label.new(x=bar_index, y=cash_and_equivalents, text="Cash & Equivalents", textalign=text.align_left, textcolor=color.white, color=color.lime, style=label.style_label_left, size=size.small)

// Returns History and Analysis
roe = financial(syminfo.tickerid, "RETURN_ON_EQUITY", period) / 100
roic = financial(syminfo.tickerid, "RETURN_ON_INVESTED_CAPITAL", period) / 100
roa = financial(syminfo.tickerid, "RETURN_ON_ASSETS", period) / 100
RandDtoRevenueRatio = financial(syminfo.tickerid, "RESEARCH_AND_DEVELOP_TO_REVENUE", period) / 100

// Show it? then plot it //
showReturn = input(false, title = "Show Returns?")
plot(showReturn?roe:na, title="ROE", color=color.blue, linewidth=3, style=plot.style_linebr)
plot(showReturn?roic:na, title="ROIC", color=color.teal, linewidth=3, style=plot.style_linebr)
plot(showReturn?roa:na, title="ROA", color=color.purple, linewidth=3, style=plot.style_linebr)
plot(showReturn?RandDtoRevenueRatio:na, title="R&D revenue to ratio", color=color.green, linewidth=3, style=plot.style_linebr)
hline(showReturn?0.2:na, color=color.orange, linewidth=2)

if (showLabel and showReturn)
label roeBox = label.new(x=bar_index, y=roe, text="ROE", textalign=text.align_left, textcolor=color.white, color=color.blue, style=label.style_label_left, size=size.small)
label roicBox = label.new(x=bar_index, y=roic, text="ROIC", textalign=text.align_left, textcolor=color.white, color=color.teal, style=label.style_label_left, size=size.small)
label roaBox = label.new(x=bar_index, y=roa, text="ROA", textalign=text.align_left, textcolor=color.white, color=color.purple, style=label.style_label_left, size=size.small)
label RandDtoRevenueRatioBox = label.new(x=bar_index, y=RandDtoRevenueRatio, text="R&D to Revenue Ratio", textalign=text.align_left, textcolor=color.white, color=color.green, style=label.style_label_left, size=size.small)


hline(ZEROLINE)
Any suggestion of improvement is welcome!!