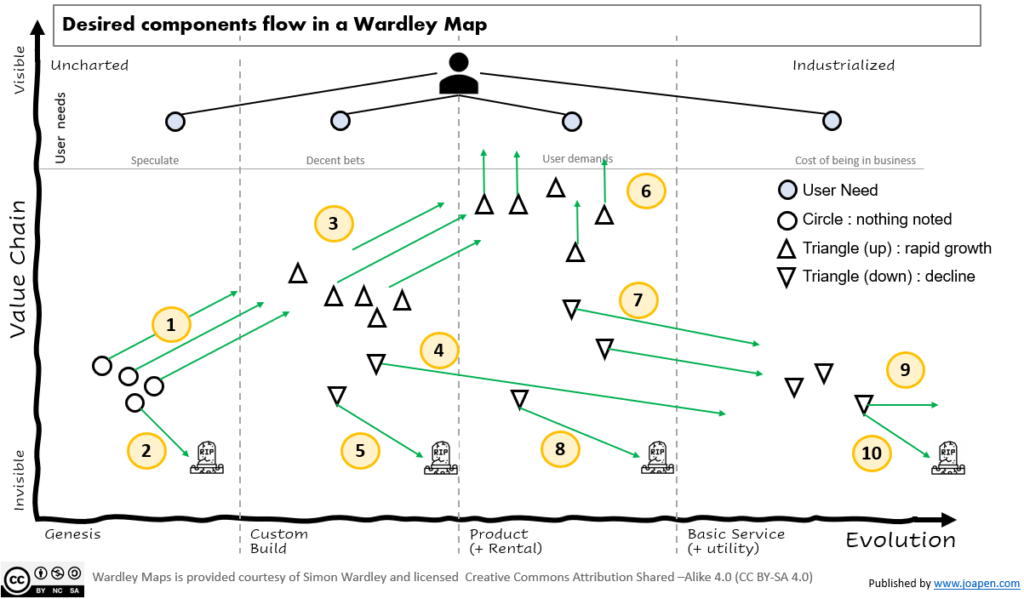
This is a theoretical exercise out of context that helps me to explain the evolution of components into a map.
It contain a lot of capital flow management decisions, which means that you have to have a clear definition about what is the expected balance between capital expenditure Vs. added value provided.
It’s an ideal map flow, which means I have simplified the flows and so many of undesired flows have not been drawn.
The map
The decision points for the components are typically close to the liminal lines between stages (for instance between genesis and custom build). There is where the majority of the decisions to invest are done. This is because it’s time to discard or to move the component to the next stage, and the move to a more evolved version means investment (entropy).
I have generalized the user needs into 4 main categories. Depending on the context the importance of these needs will have more or less weigh, but for this exercise is irrelevant.

The meaning of the dynamics represented by numbers:
- Investment done on speculative components survive and is pushed towards Custom Build (usually low % of invested budget)
- Investment done on speculation does not work and it’s discarded (usually high % of invested budget)
- The “decent bets” capabilities grow and more investment is done to promote more growth and/or a move towards product.
- The “decent bets” capabilities decline and they are substituted by an existing service. Added value was not proved but the capability is required.
- The “decent bets” capabilities do not work and are discarded.
- “User demand” capabilities grow, and you try to make them more visible. It should coincide with higher amount of revenue.
- “User demand” capabilities decline, investment done to make the product to be delivered as a service.
- “User demand” capabilities drop hard, so it’s discarded.
- Service component matures through minimum investment.
- Service component is discarded.
Let’s finish!
Do you think it’s useful? As usual, feedback is welcomed!