This is the third version of a code I have started to write while learning the concepts of Machine Learning.
Changes with respect the previous versions
- Shift(-1) have been removed for the SPX price, I consider is an error to add it.
- I have added data related to DIX, GEX (since 2011) and VIX (since 1990).
- I have used the same regressor from XGBoost.
- I have discovered a library called Plotly so data can be drawn in a better way: change date range, remove or add lines, etc.
The code
The code is published here on CoLab, in case you want just to review it there.
Some comments
The amount of data related to market breadth comes from 1972, the one from DIX and GEX only since 2011, and VIX from 1990. I have doubts about the impact of this lack of data.

The correlation of data, we can see that there is few correlation between DIX, GEX, VIX and the rest of the data. I’m not sure about the root cause: just because there is not correlation, if there is impact because the difference of amount of data, or any other reason.

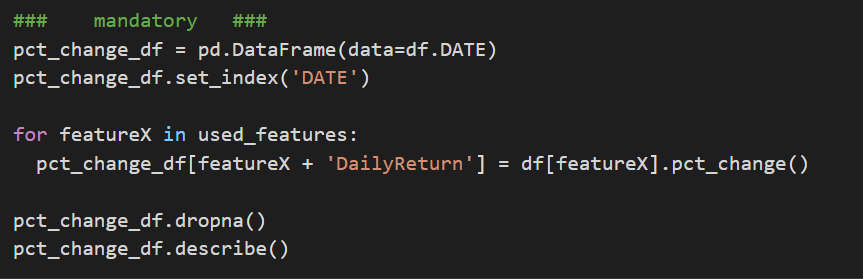
I have transformed all data in relative data from one day to other, so in this way I focus on daily changes of all features.
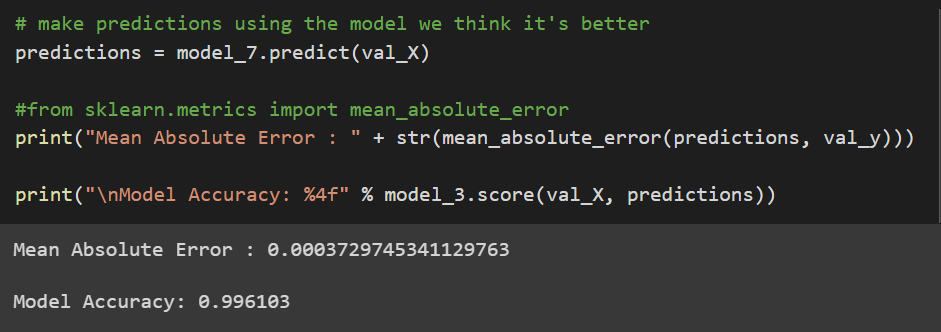
From the 10 models I run the one with less MAE is the #7:
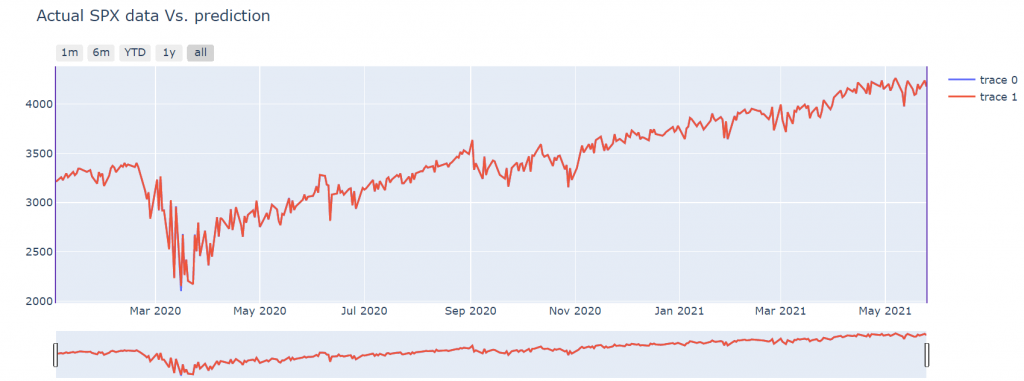
Plotly library is much better than seaborn or matplotlib. You can add a lot of visual features that enable you to have a more interactive charts. Blue line is actual S&P 500 value, the red line is the prediction (in terms of change.)

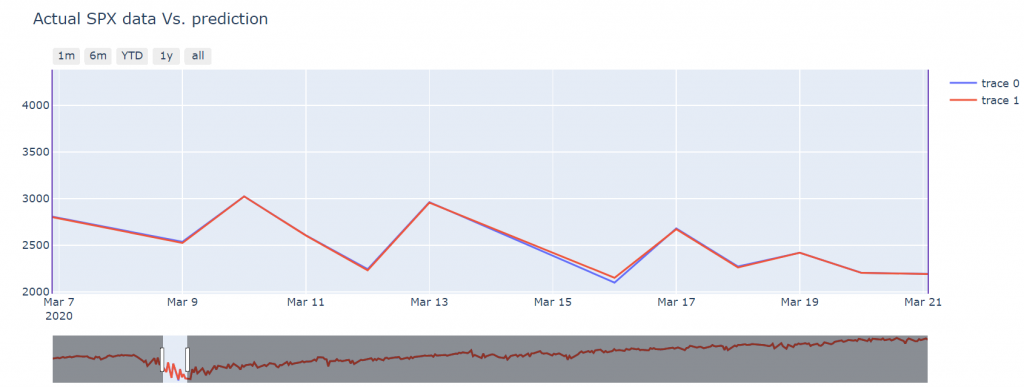
The accuracy is good for the period where S&P 500 is stable, you can see that during March 2020 you can differentiate the blue and red line better.
The zoom helps to visually detect when there error is higher:
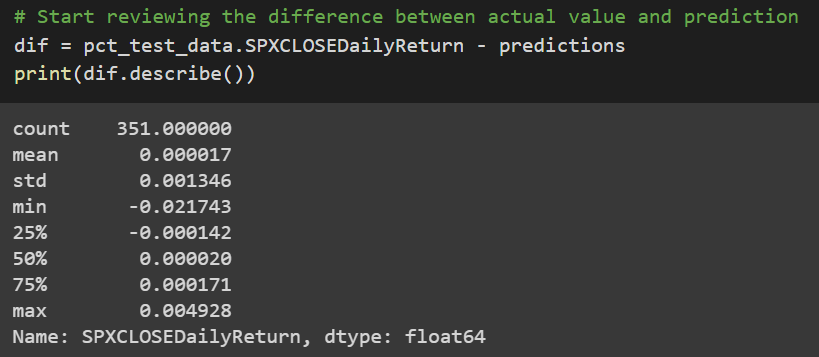
I have calculated the difference between the actual SPX daily return and the predicted data, my purpose is to add accurate to the prediction when evaluating the TP, FP, TN, FN.
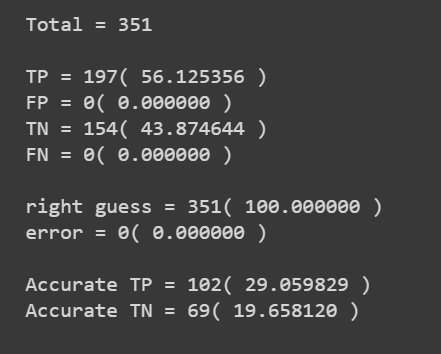
Let’s check the performance of the prediction: True Positive, False Positive, True Negative and False Negative.
Final thoughts
I have to continue learning about the different models and how their behavior is.
I already have seen how to take this basic model and do the traditional backtesting that is done on every quantitative trading system, so I can try to get a more realistic conclusion about the results.
I have to find the way to add more data in an automatic way, and play with other values that enable me to find more correlations.
So many things to learn in front of me.
Please in case you have any feedback, glad to read about it.