This code is an indicator composed by 2 pieces of code that have been combined.
- Big players by Konkorde that are buying (https://www.blai5.net/blai5-koncorde-la-importancia-del-volumen/)
- DarkPool Index when it’s over 35% (https://squeezemetrics.com/monitor/download/pdf/short_is_long.pdf?)
The individual goal of these indicators is to point to big player buying. So what if we combine the 2 indicators?
The code
study(title="Koncorde Big Players + DarkPool Index", shorttitle="P3-Koncorde-Big-Players+DPI", overlay=true)
// Konkorde by Blay5 https://www.blai5.net/

//We set the total Price as starting point
totalprice=ohlc4
//MONEY FLOW INDEX Y SU XMF

MoneyFlowIndex(periodo) =>

    valor = hlc3
    pos = sum(volume * (change(valor) < 0 ? 0 : valor), periodo)
    neg = sum(volume * (change(valor) >= 0 ? 0 : valor), periodo)
    rsi(pos, neg)

xmf = MoneyFlowIndex(14)

//ESTOCÁSTICO SUAVIZADO

esto(variable, periodo, suavizado ) =>
    ll = lowest(low, periodo)
    hh = highest(high, periodo)
    k = 100 * (variable - ll) / (hh - ll)
    sma(k, suavizado)

stoc = esto(totalprice, 21, 3)

VarPrecio = (close - close [1])/close[1]
VN = (volume < volume[1] ? VarPrecio : 0)
nvi = cum(VN)
nvim = ema(nvi, 15)
nvimax = highest(nvim, 90)
nvimin = lowest(nvim, 90)
azul = (nvi - nvim) * 100/ (nvimax - nvimin)

////////////////////////////////////
//   Dark Pool Index (DPI)
////////////////////////////////////
//pull, calculate, and smooth individual stock DPI for the selected symbol
//pull the NASDAQ and NYSE Short Volumes from Quandl FINRA.
NASDAQSHORT = security("QUANDL:FINRA/FNSQ_" + ticker + "|0", "D", close)
NYSESHORT = security("QUANDL:FINRA/FNYX_" + ticker + "|0", "D", close)
//combining the NASDAQ and NYSE Short Volumes from Quandl FINRA.
TOTALSHORT = NYSESHORT + NASDAQSHORT

//pulling the NASDAQ and NYSE Total Volumes from Quandl FINRA.
NASDAQTOTALV = security("QUANDL:FINRA/FNSQ_" + ticker + "|2", "D", close)
NYSETOTALV = security("QUANDL:FINRA/FNYX_" + ticker + "|2", "D", close)
//combining the NASDAQ and NYSE Total Volumes from Quandl FINRA.
TOTALV = NASDAQTOTALV + NYSETOTALV

//Individual DPI calculation
DPI = TOTALSHORT / TOTALV
arrowDPI = (DPI>0.35 and azul>0)  ? azul*-1 : na

//plot(azul, color=#00FFFF, style=area, title="azul")
//plot(azul, color=#000066, style=line, linewidth=1, title="lazul")

//plot(DPI, title="Individual Stock DPI", color=blue, linewidth = 2, style=line)
//plot(DPIarrow, title="DPI arrow", color=orange, linewidth = 1, style=line)
plotarrow(arrowDPI, colordown=black)
An example
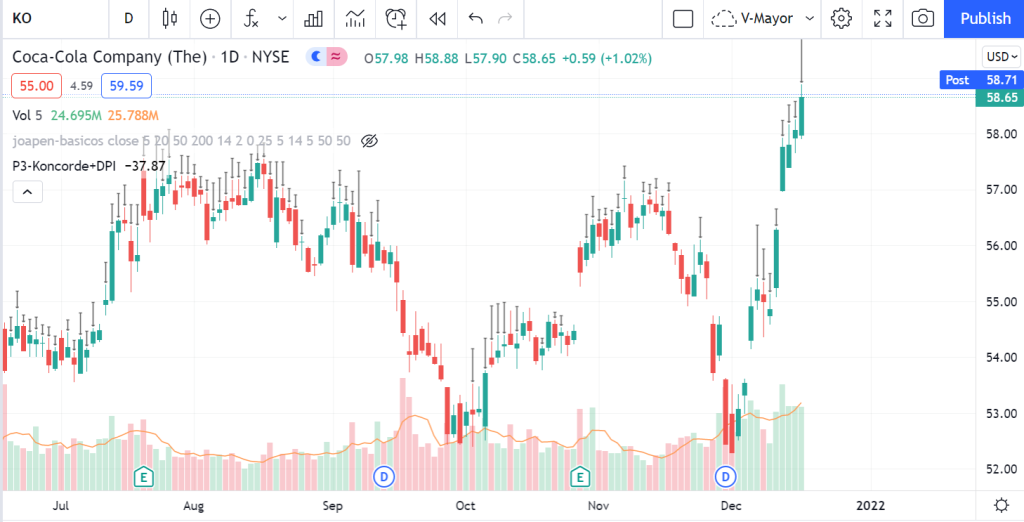
Note that the length of the arrow is linked to the konkorde big players volume: the longer the arrow is, the strong than Konkorde is pointing to the buy signal.
Right now I’m using it in test mode (that’s the reason you see a “P3” in the beginning of the name).
As usual, any feedback is welcome
Dear Author, Excellent analysis actually. I wonder no one realizes how important this indicator is. Please give us an update if you’ve upgraded the indicator and back tested it.
Thanks!
Hello Sashi,
no updates to the indicator, I continue using the published one.
best regards,