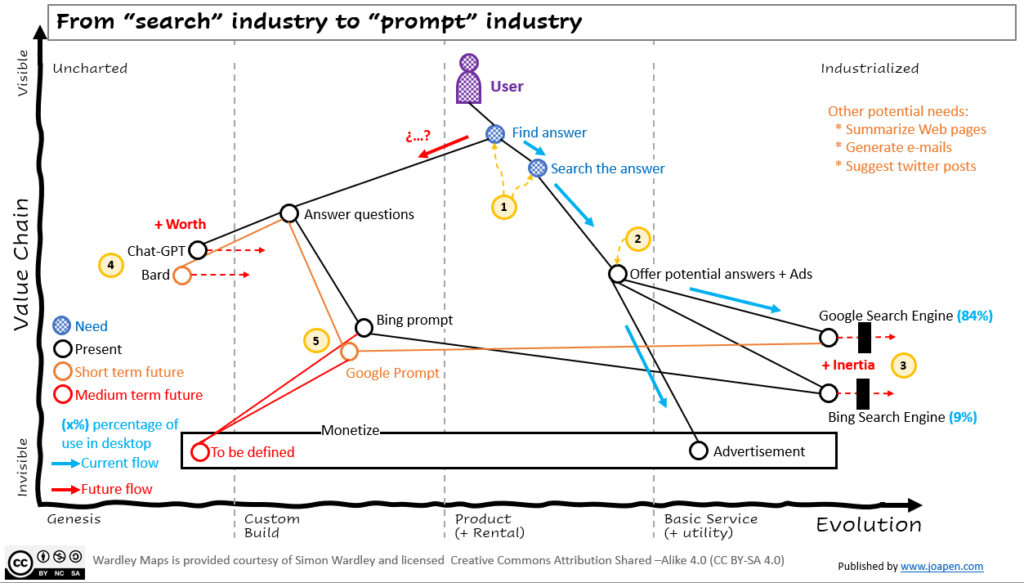
The scenario represented on this map is very well known by many users that read about tech trends and new technologies announcements.
The map is the representation of my view of the situation, and everybody is welcome to challenge the map.

The interesting part to me is not the map itself. I think this scenario is really interesting for those that want to learn about climatic patterns, and use a well known scenario to remind them and understand the importance of these patterns in the dynamics of the companies.
If you want to watch how I see the map, you can watch this video:
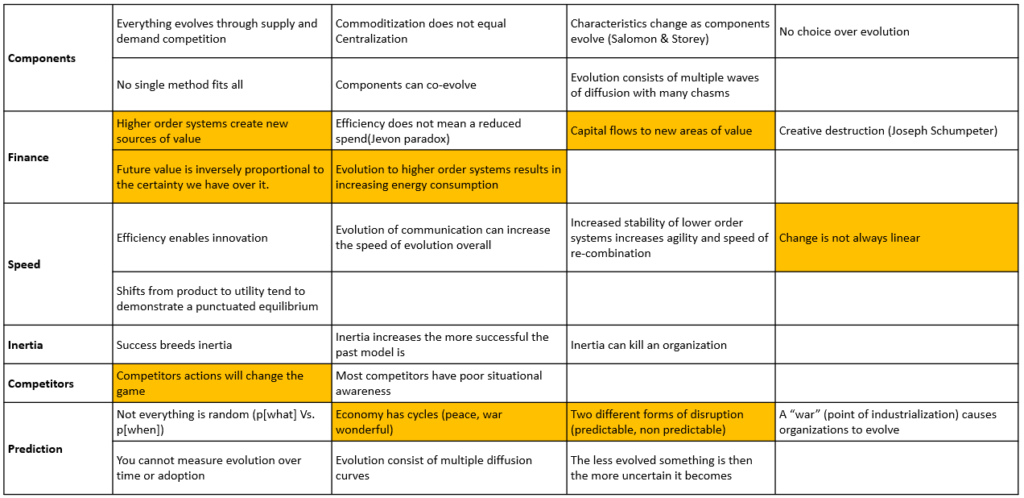
Wardley’s Climatic patterns
I have highlighted the ones that are more interesting to me.
What are in your view the more interesting patterns for you?
