Squeeze Momentum Indicator by LazyBear is a volatility indicator that I discovered in TradingView.
https://www.tradingview.com/script/nqQ1DT5a-Squeeze-Momentum-Indicator-LazyBear/
This is a derivative of John Carter’s “TTM Squeeze” volatility indicator, as discussed in his book “Mastering the Trade” (chapter 11).
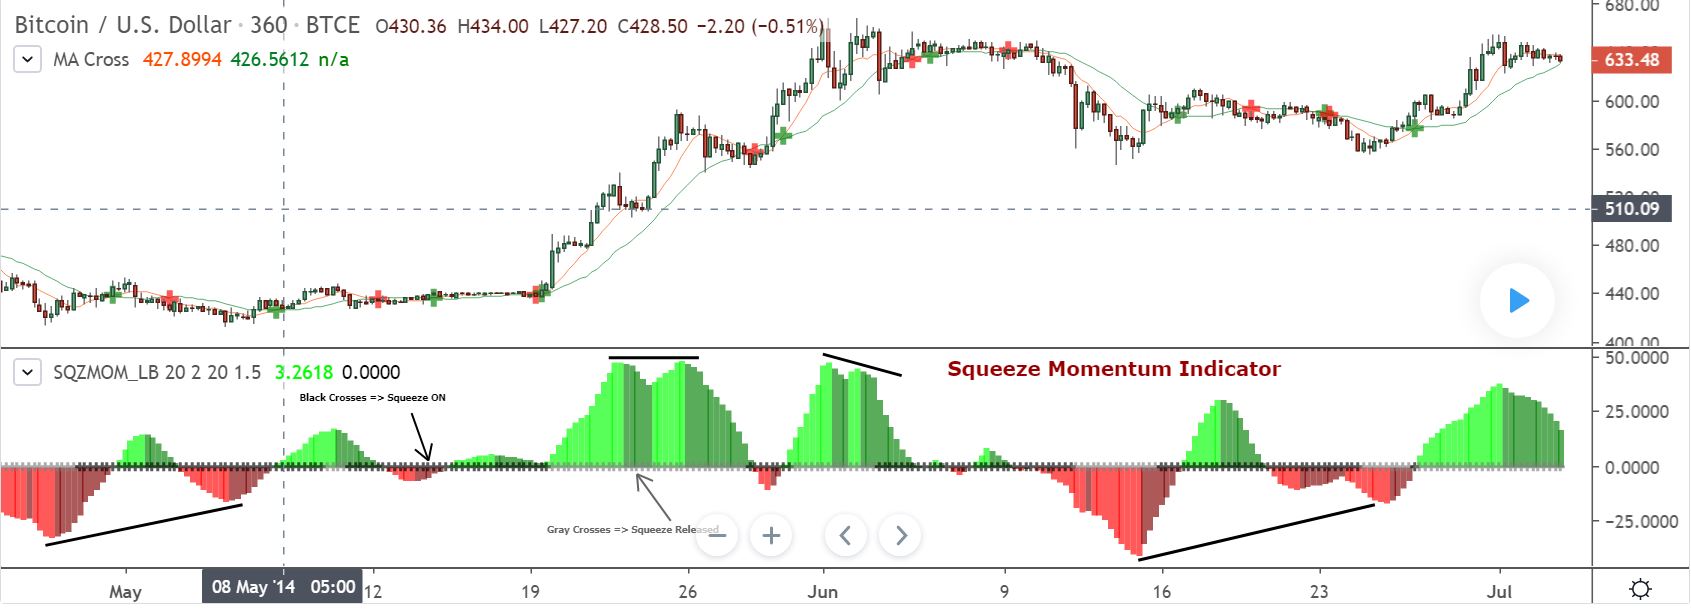
Black crosses on the midline show that the market just entered a squeeze ( Bollinger Bands are with in Keltner Channel). This signifies low volatility , market preparing itself for an explosive move (up or down). Gray crosses signify “Squeeze release”.
Mr.Carter suggests waiting till the first gray after a black cross, and taking a position in the direction of the momentum (for ex., if momentum value is above zero, go long). Exit the position when the momentum changes (increase or decrease — signified by a color change). My (limited) experience with this shows, an additional indicator like ADX / WaveTrend, is needed to not miss good entry points. Also, Mr.Carter uses simple momentum indicator , while I have used a different method (linreg based) to plot the histogram.
How do I use it?
I check different indicators under the triple screen framework, and the Squeeze Momentum Indicator is in the intermediate screen.
Awesome write-up, thank you.
My blog post Northwest Brokers
Hello, what is the relationship between Squeeze Momentum and VWAP?
Hello Placton,
VWAP is calculated by adding up the dollars traded for every transaction (price multiplied by the number of shares traded) and then dividing by the total shares traded. So it takes into account the volume.
Squeeze momentum, as far as I know does not use volume on the code,
best regards