I have started to follow-up the Dark Index Vs SPX, as one of the indicators I follow during the decisions. Right now it’s in test mode, as I have to learn about what happens and see if I can build some type of correlation that contributes in a positive way to my trading actions.
So, let’s start.
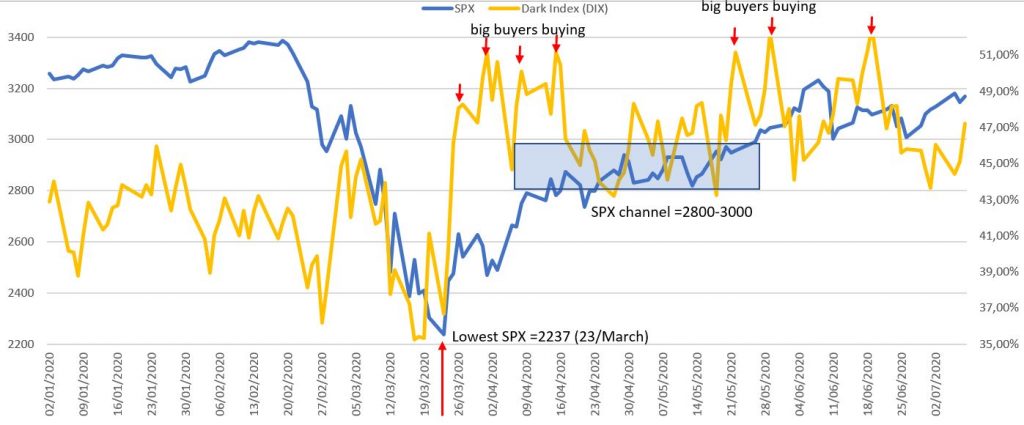
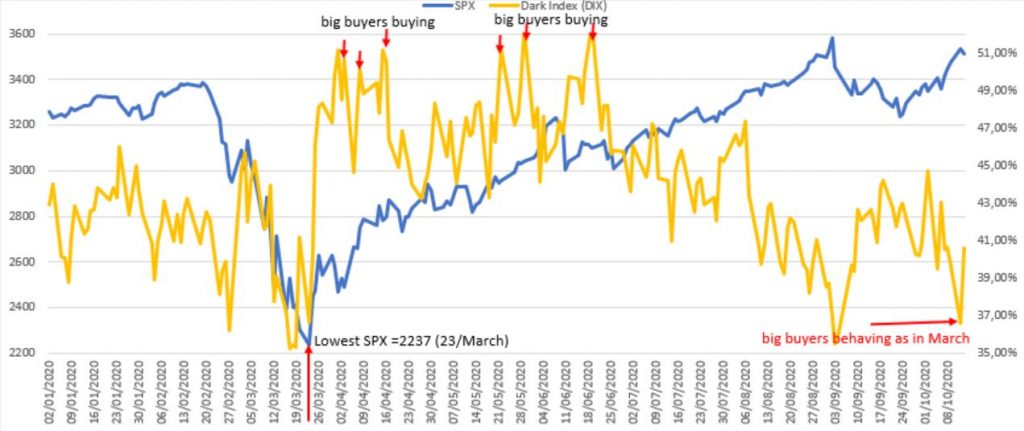
First chart (January 1st – April 30st)
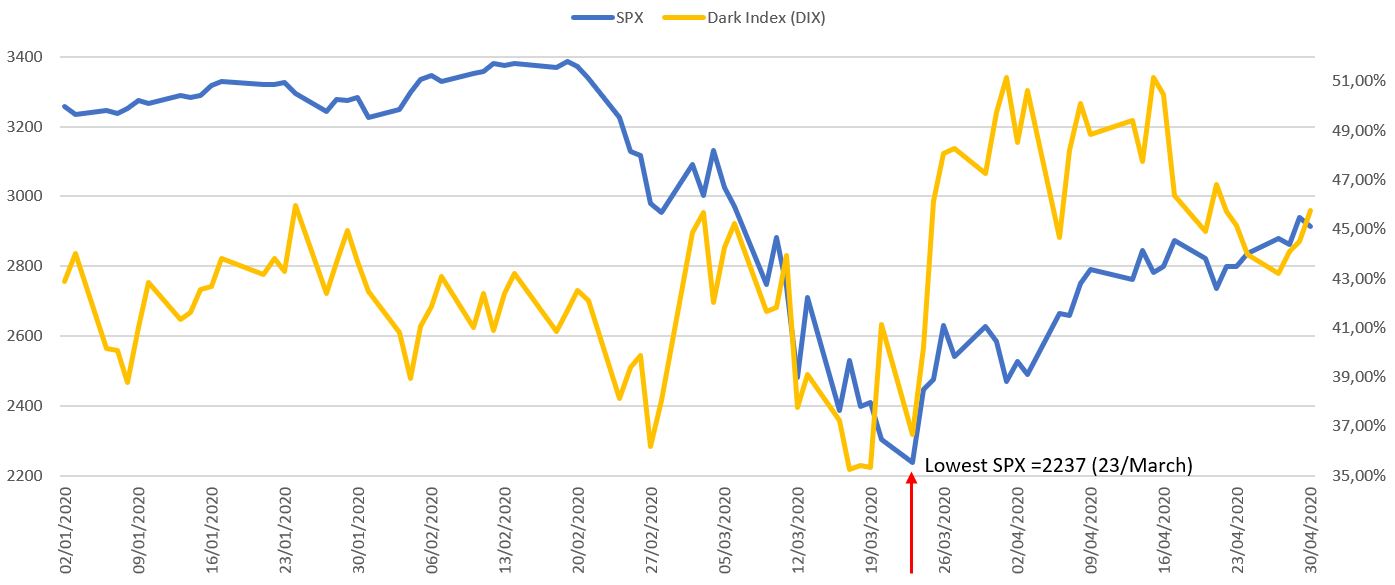 When DIX is up, it’s assumed the whales are buying in a silent way. Some trends:
- February 27th
- March 24th
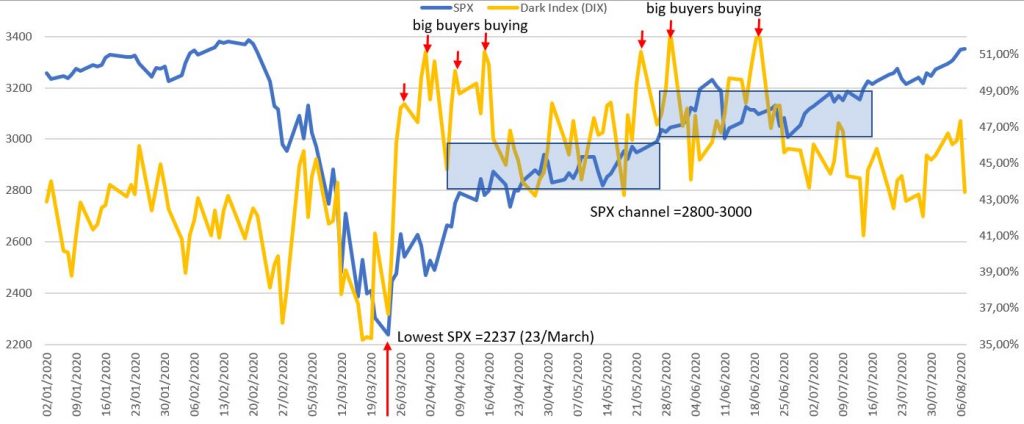
Second chart (January 1st – June 8th)
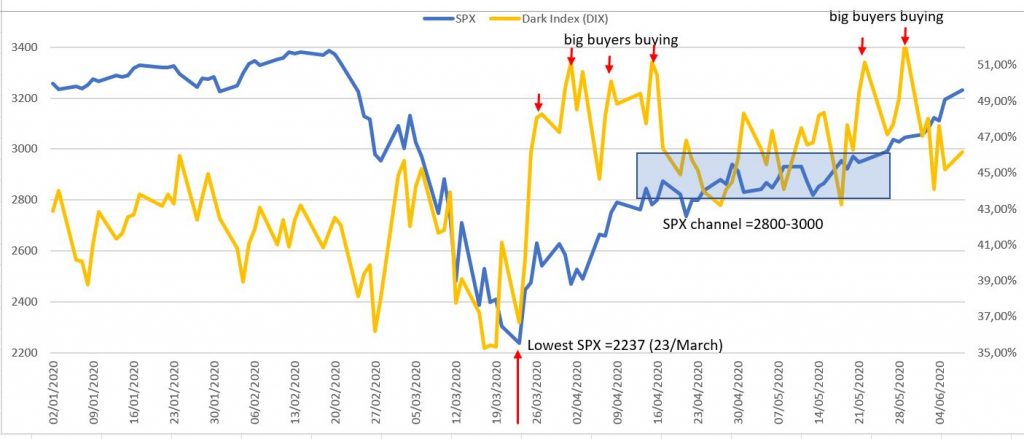
- Strong concentration of buyers starting on May 21st and continuing during 1 week (over 50%).
- SPX was in a channel (2800 -2950), between April 14 and May 26th.
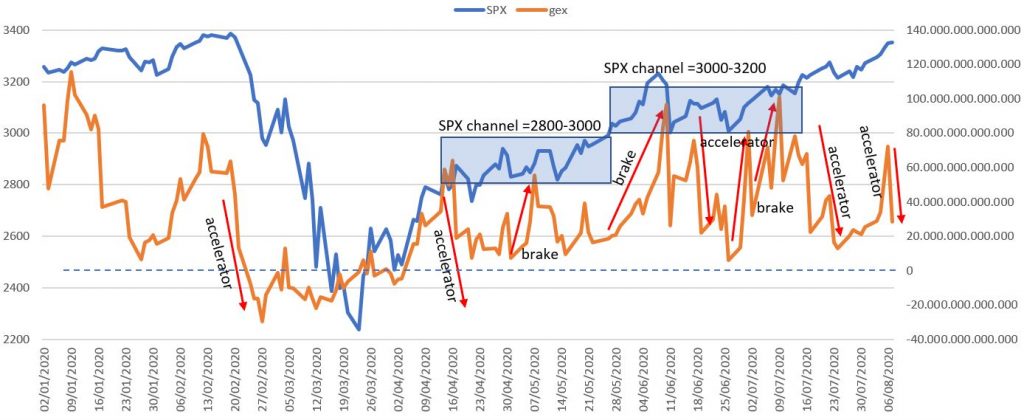
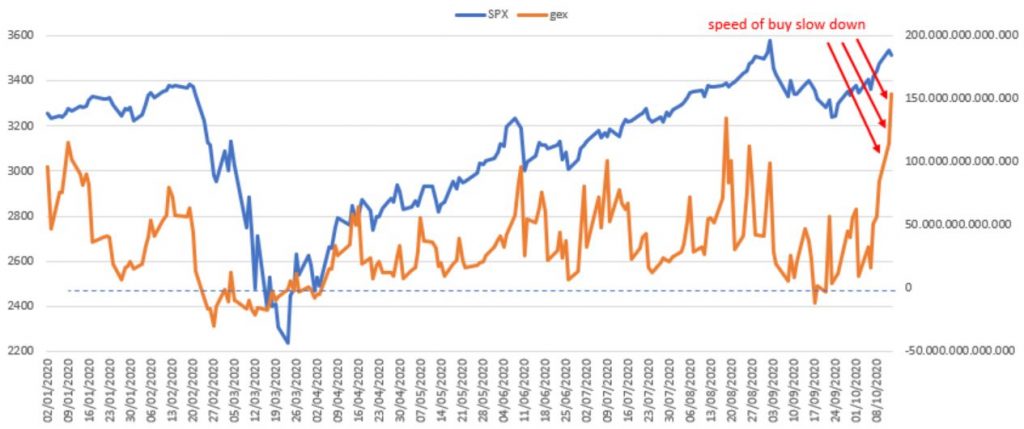
GEX review on June 8th
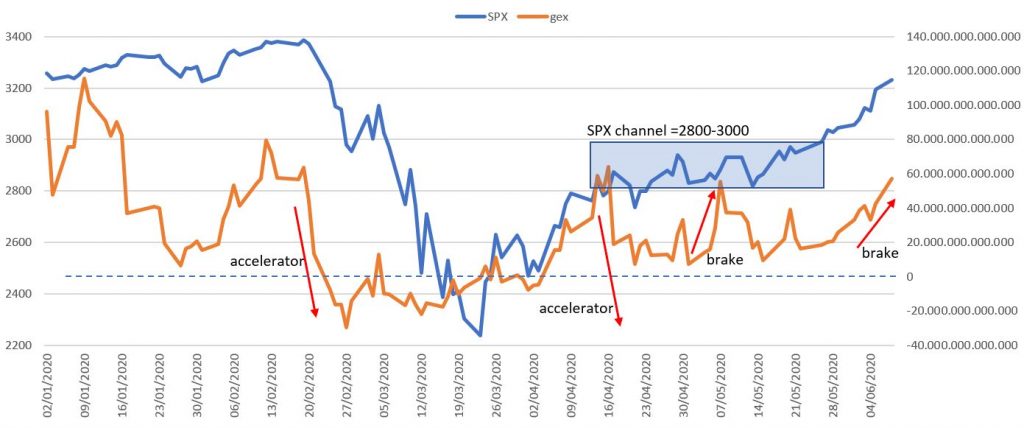
- Gamma Exposure Index < 0 was a risk zone. Started on February 24th.
- During the channel (2800-3000) no clear behavior.
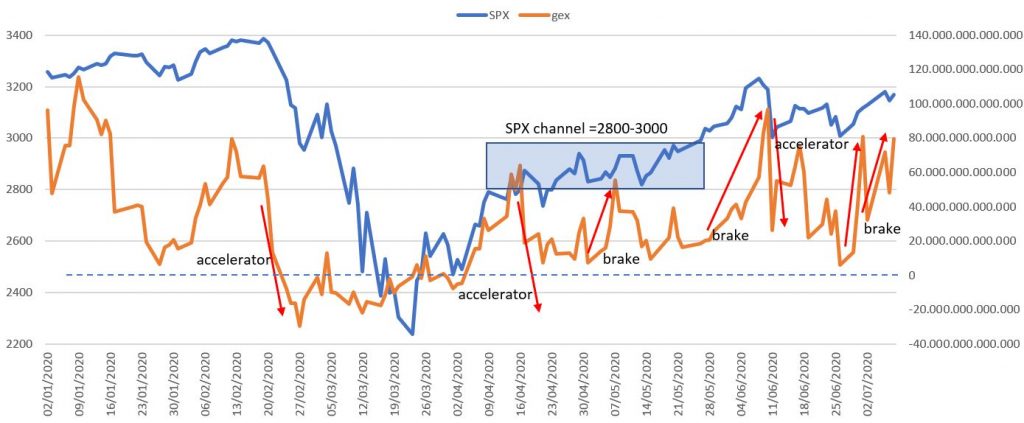
GEX review on July 8th
So much ups and downs (accelerate and brake).
DIX review on July 8th
Nothing to add here related to DIX during June.
DIX review on August 8th
- Channel 3.000-3.200 has been broken, now working between 3.200-3.400.
- Dark Index moving around 45%.
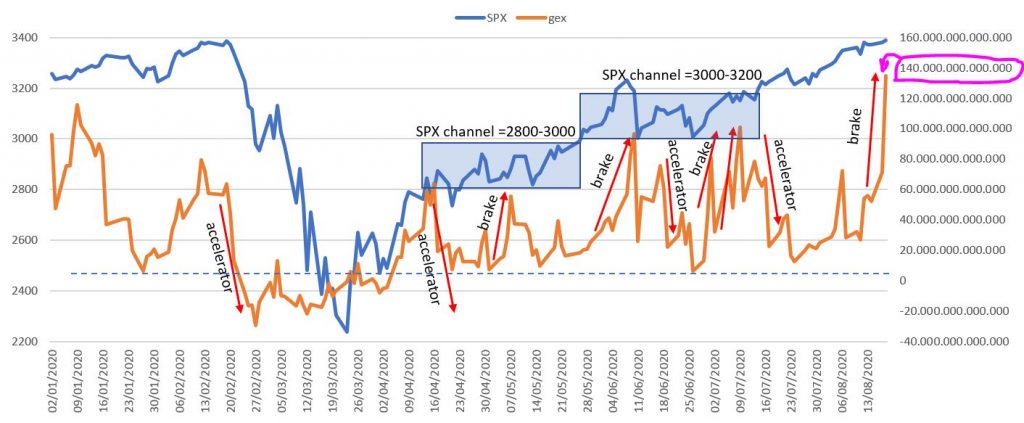
GEX review on August 8th
- 2 strong “push” to the accelerator put the S&P over 3.300.
GEX review on August 18th
- GEX reachs 131.000.000.000.000 units, which means the highest value of this indicator since it was created. It’s the major “brake” to the use of dark pools ever.
DIX review on October 13th
DIX values are similar to the values taken in March (below 37%).
GEX review on October 13th
in the last week, the highest values in GEX means that the major buyers are using the “break” and the purchases are slowing down. On October 13th the highest seen: 153.455.662.942.850.
Hi
great article!
would you know which information i will need to calculate values myself? not much willing to click on a website and want to see if i can automate – not willing either to use selenium etc….
could you offer any advices?
thanks and regards
Hello Marco,
good question, I did it to myself when doing this on a sheet.
You most than probably know that you can download S&P 500 data from yahoo automatically. The problem is the DIX data, that is offered via CSV and I have not found a way to do it without Selenium or other tool that just navigate on https://squeezemetrics.com/
I do not know if they offer this data via service on the paid service, but in any case it’s expensive.
There are other data providers that offer this type of data, but all are expensive, at least I do not know anybody that offer publicly.
best regards,
Joaquín