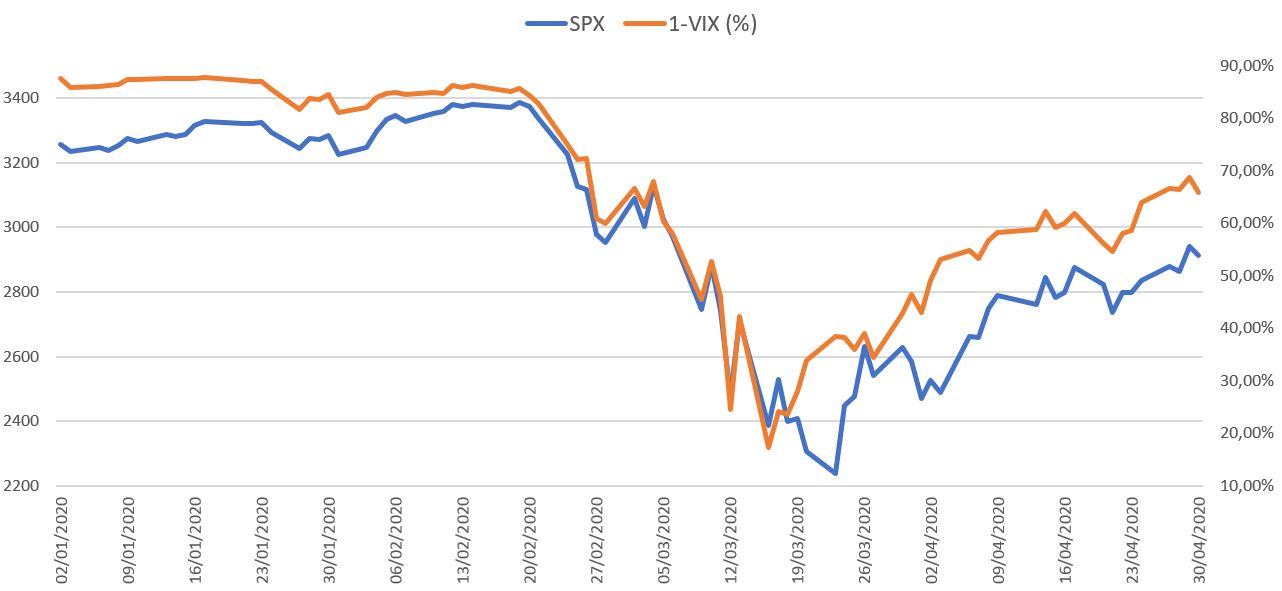
I have been trying to find correlations in terms of what have been happening during last 4 months in the US market and I found something that I need to see in deep.
I added Volatility Index (^VIX) to a chart, but the figure was so bad. I did “1 minus VIX” and added to the chart, so you can see what happened:
 I have to find if this type of correlation is repeated from time to time or if it is something that just happened this time.
Let’s see other years
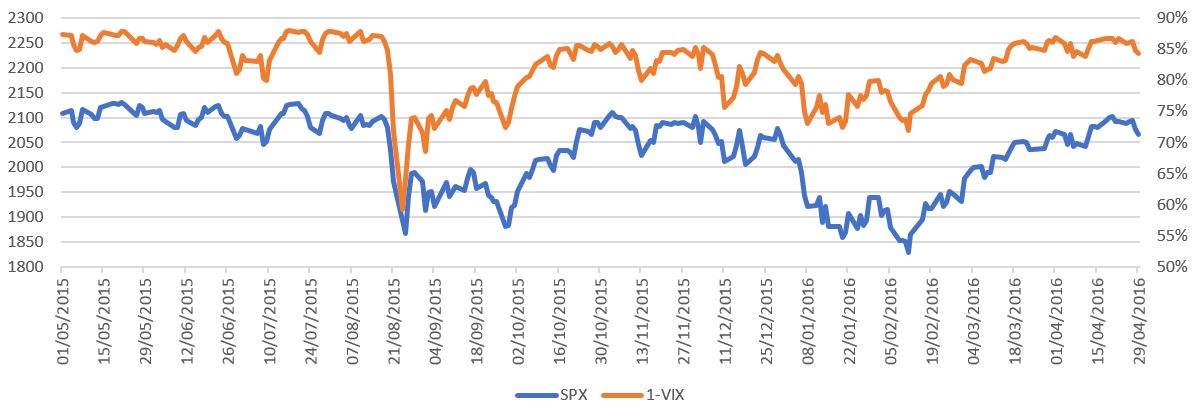
I checked the same period but in 2015. This was the result:
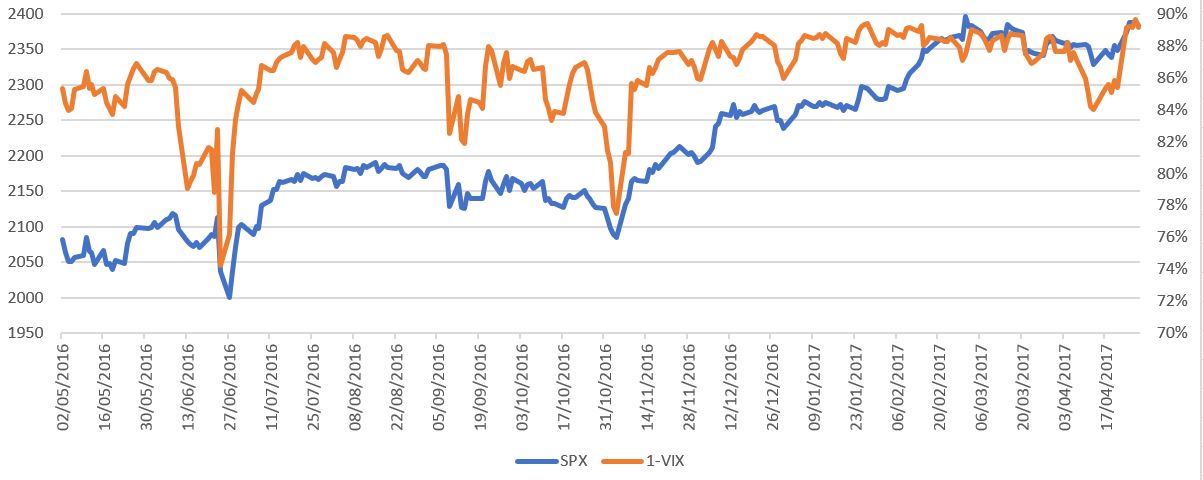
I checked the same period but in 2016. This was the result:
Conclusion?
No relevant conclusion