Two specific indicators, the Dix and the Gex, have been born from the investigations of SqueezeMetrics. They serve to monitor the behavior of short orders in the Dark Pools, which gives us an idea of the bullish sentiment of the real market:
These indicators are the way to get our analysis to incorporate the indications obtained in high frequency trading. For me they are a complement.
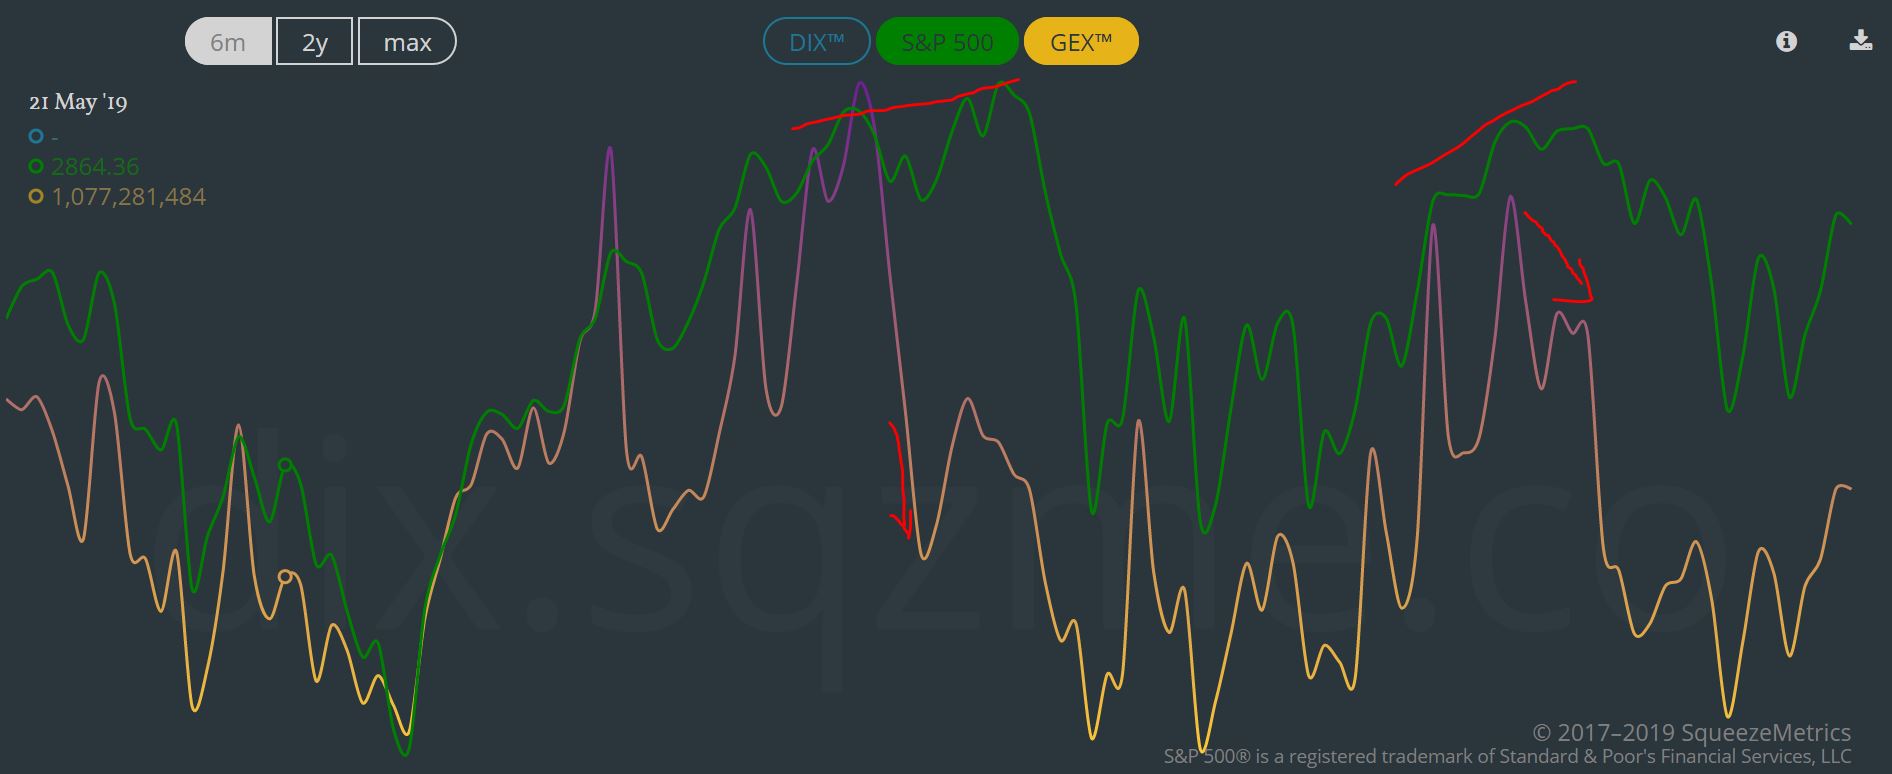
They are not easy to follow and extract conclusions right away, but sometimes they help. Specially to try to identify divergences. Below an example between GEX and S&P.
The Dark Index (DIX)
The DIX is simply the aggregated dark pool indicators of the S&P 500 Index. It is, therefore, a measure of market sentiment from the point of view of dark liquidity—a largely unexplored source of information. For the sake of utility, the DIX uses dollar-weighted trading volume to compute the ratio of dark pool buying to dark pool selling.
Since DIX tends to rise into corrections, we are left to believe that it reflects
a broad willingness of investors to accumulate S&P 500 component stocks at
lowered valuations, and that a decrease correspond to
sell trend on the dark pools.
- When DIX is high, it means ppl are silently buying.
- When DIX is low, it means they are selling.
The Gamma exposure (gex)
- When GEX is a high number, it acts as a brake on market price.
- When GEX is low (including negative), it acts as an accelerator.
Both indexes are updated by 6:00pm ET except when market data is delayed.
Updated data on a web page
I’m working on a web version of the data with parameters better adapted to my visualization
Disclaimer: I’m doing changes to try to update the data automatically (work in progress).
Reviewing the indexes during 2020
I’m doing from time to time a revision of the indexes to see if this is something I can add to my decision making process. The benefit of doing it, is that I can observe better the behavior.
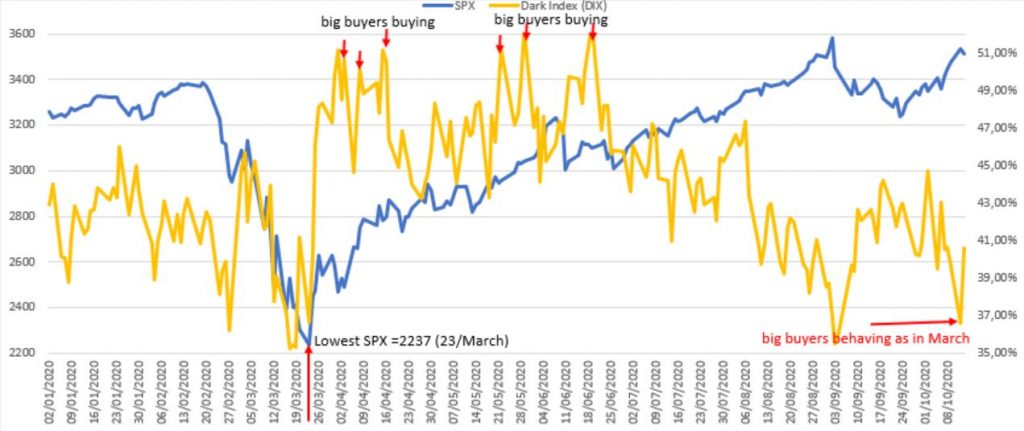
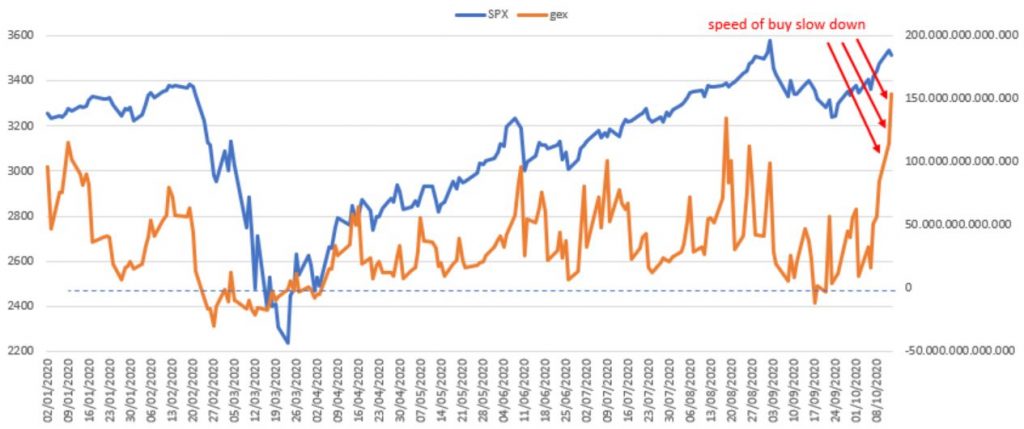
Last update (13/10/2020):
DIX values are similar to the values taken in March (below 37%).
GEX: in the last week, the highest values in GEX means that the major buyers are using the “break” and the purchases are slowing down.
How can I analyze data from dark pools related to specific markets or company?
Both Finra and BATS / CBOE publish total and short volume data on a daily basis in the dark pools.
Where can I find some of these pools?
Well there are some independent companies that offer these services, as:
- Chi-X Global (https://www.chi-x.com/)
- Instinet (https://www.instinet.com/)
- Liquidnet (https://www.liquidnet.com/)
- Virtu Financial (https://www.virtu.com/)
- TORA Crosspoint (https://tora.com/)
- ETF One (http://etf.one/)
And the major banks provide these services too: JP Morgan, Goldman Sachs, BNP Paribas, Nomura, Credit Suisse, Wells Fargo….
me gustan los indices
paso a estudiarlos para seguimiento
Gracias
anton3roche@yahoo.es
Helpful Thank you !
Thanks for your insight. Could you elaborate more on how “high levels of short volume correspond to positive medium-to-long term investor outlooks”? I have a hard time understanding that bit.
hello Emil,
thanks for the comment, it’s a mistake done by my side. I have corrected it,
best regards
thank you for the analysis, could you please post your spreadsheet?
Hello John,
I have not the updated spreadsheet, you can download the data from here: https://squeezemetrics.com/monitor/dix?
and build your own spreadsheet.
BR