The american market (I focus on S&P 500) has recuperated 40% of the value since March where it touch the minimum value.
It’s an impressive “come back” while the macro economy data is showing terrible numbers about unemployment, consumption, industrial production….
The economy and the market are driving themselves in the opposite direction. So, so many questions come to my mind:
- Is the market crazy?
- is the market completely disconnected from the economy?
- are we looking at the right numbers?
Well, Mr. Market does what he wants, and we cannot do anything about it. Disconnected from the economy? I do not think so, maybe there is a bubble, but sooner or later it will adjust. Well, my answers are poor, and it’s basically because I have not a concrete answer to these questions.
The last question: “are we looking at the right numbers?” makes me to go to Value Line Geometric Index
Value Line Geometric Index
This index includes all the american market. For more information the Wikipedia.
“All companies in the Value Line Composite Index are publicly listed on one of the major exchanges listed below. The number of companies in the Value Line Composite Index fluctuates based on factors including: the addition or delisting of the companies on the exchanges themselves, mergers, acquisitions, bankruptcies, and the coverage decisions made by Value Line for the Value Line Composite Index. Value Line’s decisions as to which companies to include are undertaken with the intention to create a broad representation of the North American equity market.
Exchanges in The Value Line Composite Index are:
- American Stock Exchange
- NASDAQ
- New York Stock Exchange
- Toronto Stock Exchange
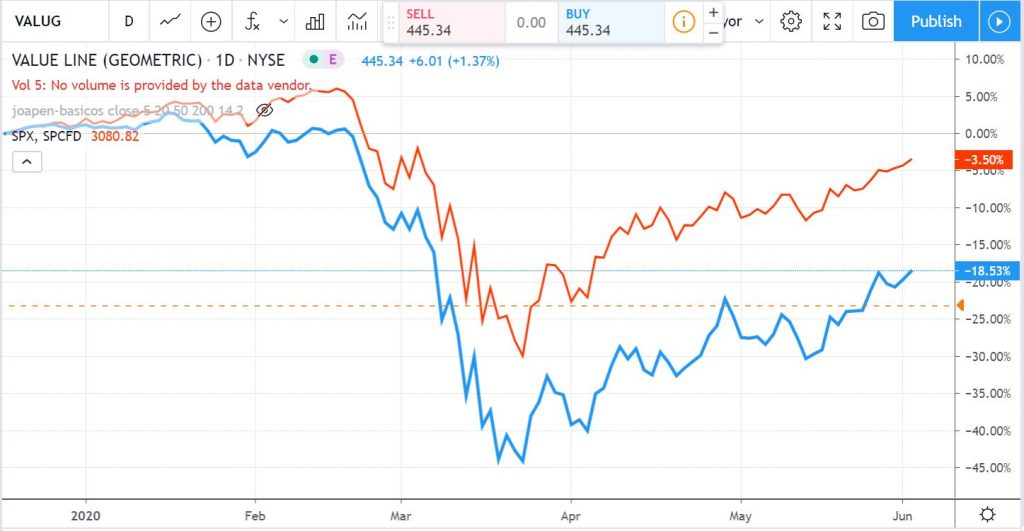
Well, comparing the VALUG (blue) with SPX (red), you can see that Value Line Geometric Index is more closed to the reality that I had in mind that is that we still have not recuperated.
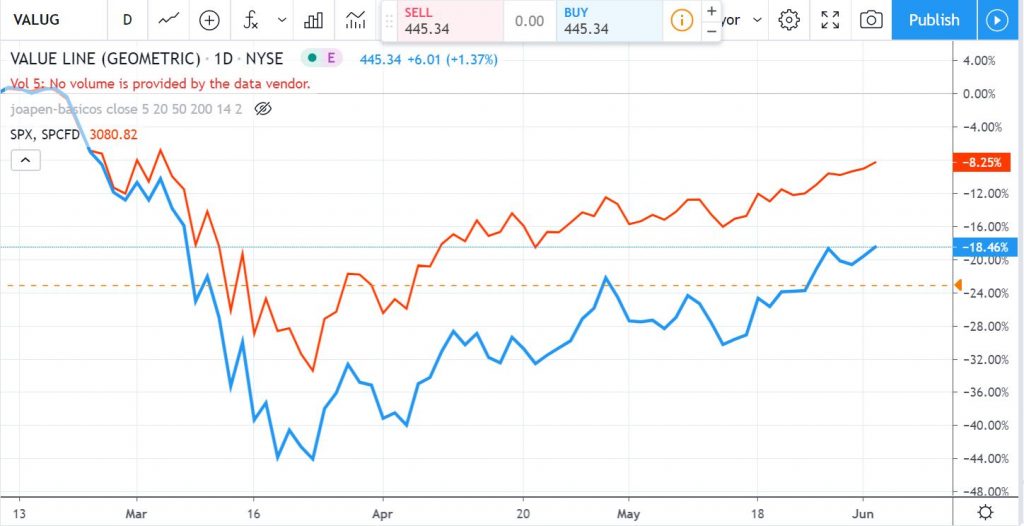
 If we look the comparison of the indexes from February 12th, the result is that draw-down is bigger for VALUG, and that the recuperation is below than S&P:
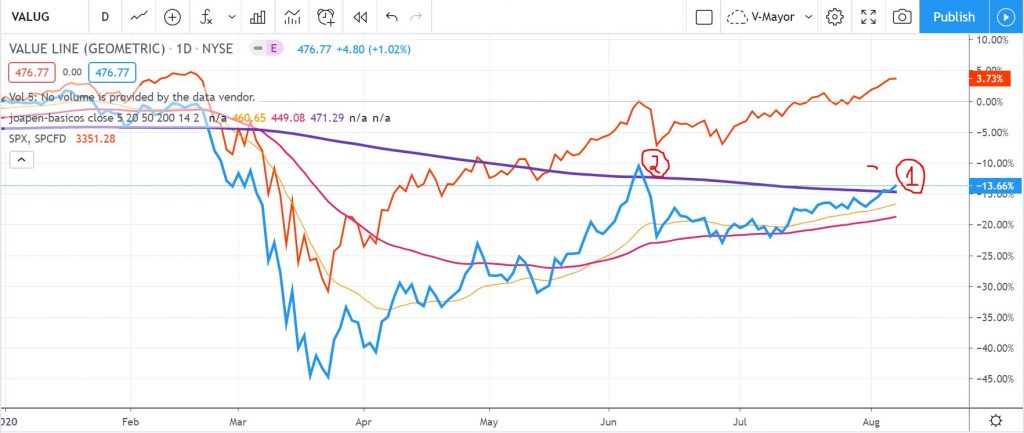
Update on 07/August/2020
- The Value line has crossed over the 200 days SMA for the second time. This is an interesting point of intersection.
- This event happened in June and the market reacted for few days. These days the FED did not use big amount of money on POMO.
To do: I will add this index to my reviews, I have first to learn from it.