In what parts of the organization should I invest?
This is something that comes from common sense (the less common of the senses). And it is that the understanding of the business priorities, the purpose of the company, the context where you are in a given moment, etc. all that is going to be part of the relevant conversation that is going to give you the points where you should prioritize the investment and do the proper analysis to see if it makes sense or not.
What is the information I can use from the map to detect where the money should go?
The map may give you some hints about which components you should invest. Here some ideas, but remember: the conversation with the right stakeholders is the right approach to define where to invest.
- The components with more lines (dependencies) use to be critical for the context you are drawing, and they are natural candidates to receive investments.
- The revision of the dynamics of the map going from the user through the capabilities, putting emphasis on the capital flows can give you ideas of points of investments.
- Pay attention to the components that are closed to the line of change of stage (for instance: the line that separates product and service). These components are subjected to receive a big amount of money by many reasons.
- The components on the low side of the map (the less visible) are subjected to be removed by replacement of other components.
- The components with more visibility to the users are the most valuable ones and they are usually the ones that keep the company competing in the market. Those that are custom build are the differential ones and they are usually the more intense in capital and attention.
- In moments where the company needs to scale some of the investment focus are on the maturity of certain components or processes (for instance: processes done manually that need to be defined, delegated and with a proper escalation process for having the right revision).
Now let’s do the quantitative analysis
Once you have decided that a component of a Wardley Map deserves some attention, it’s time to understand if the investment of capital, resources or time is valuable for your company.
There are many ways of making decisions about if an investment is valuable or not, and depending on the context you are, you use one or other method to do it. But there are some basis and it’s good to keep them clear.
I will show some basic methods starting with a simple method (ROI), going through a basic branch of a decision tree, and finishing with a decision tree with nine branches.
The basis
1.- Decisions are done in front of uncertainty
This seems very simple but sometimes we forget they are done in this way. If there is no uncertainty, then we are probably not talking about a strategic decision on a business.
2.- Work on an expected value
You make decisions looking for an expected value, but this value is not warranted. Expected value is the value of an outcome multiplied by the chances it will happen.
What are the choices you have identified in your map?
The conversation around the map, understanding the context in detail and with enough perspective probably have given you a set of alternatives that could be feasible.
Once you have reviewed these feasible alternatives and are more or less sure that there is no any constraint that make them not feasible, it’s time to understand the expected value of these options.
Return of investment (ROI)
ROI is a performance measure used to evaluate the efficiency or profitability of an investment or compare the efficiency of a number of different investments. The term comes from the investment space and it can be used in many ways.
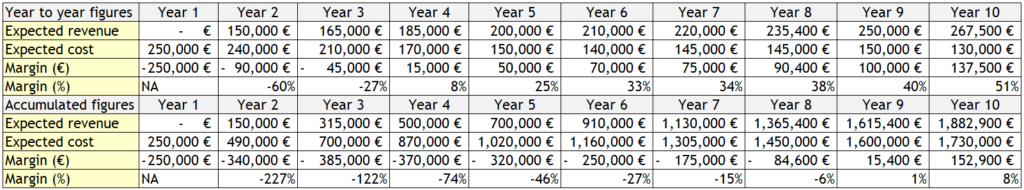
This could be in an new business you are building from scratch. In the example below, this is a new business that requires 4 years to be profitable YoY and 9 years to recover the initial investment done.
Return of investment is alto used for the improvement projects. The typical scenario is: you are operating a business with an operational cost; you identify a set of improvement actions that potentially will decrease the cost of operations. You estimate the required investment to complete the improvements and then focus on achieving the outcome: operational savings.
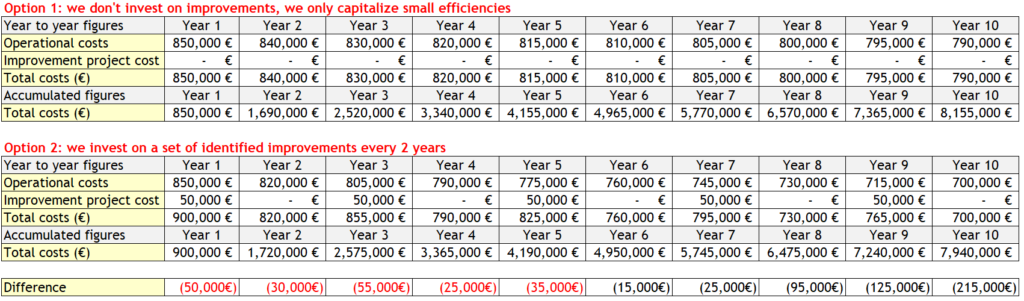
On this example below, we have 2 choices:
- Do not invest on improvements and only capitalize small efficiencies performed by the team.
- Invest on a set identified improvement actions every two years.
We can see that the second choice is better if we are operating more than 5 years.
The problem with these type of linear projections is that there are many variable factors that can affect the projections in a way that we cannot forecast.
Other major problem that the estimation of revenue is something very variable. As minimum three ranges of revenue forecast should be done: optimistic, average, pessimistic.
Decision tree analysis, one branch with three scenarios
Decision trees are another way to evaluate the feasibility of an investment taking more considerations into the equation. I will use as basis the previous example, where I’m going to add different variables to the context.
Addition of different revenue scenarios
The first thing I’m going to do it to add 3 revenue scenarios: best case, medium case and worst case scenario.

This is going to create 3 branches on the tree. The point is that this makes you to triplicate the analysis not only for the revenue, but for the expenses and margins too. This is usually done in separate tables, but for this exercise I will do it all in one table.
Each forecast is usually done with different people of the organization: revenue with sales, costs with operations or solution teams, etc.
Year over year analysis
For the 3 scenarios we have on this branch, we can analyze the different forecasted performances we are going to have on each scenario. The YoY of the 3 of them make profits starting at the end of the year #4.
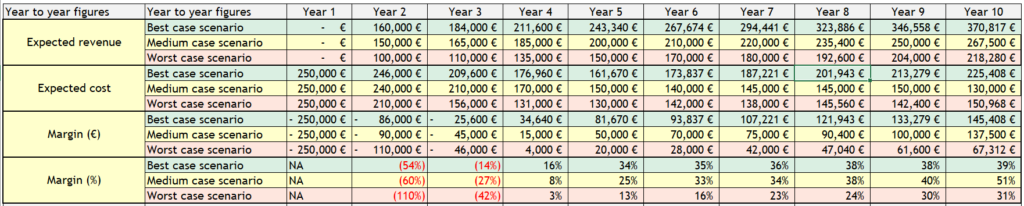
We can see that despite the sales of the best case scenario are better, the margins are not always aligned with a better result. The medium case scenario produces, in theory, a better outcome.
Is that enough? let’s see the accumulated figures to check if this investment make sense or not.
Accumulated analysis
The table below shows the accumulated figures of the same 3 scenarios of this branch:
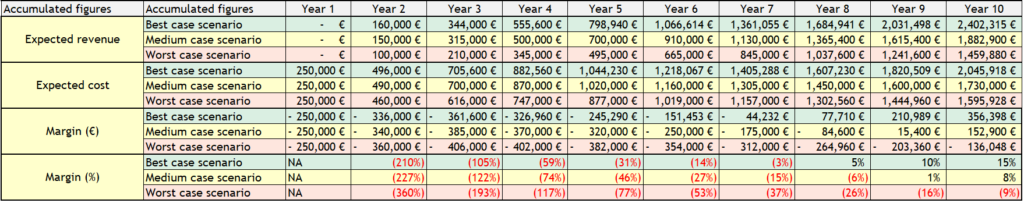
We can see different things here, but the main information comes in the final return of all the investment, the break even point happens in year 8 for the best case scenario and in year 9 for the medium case. The worst case scenario is not able to recuperate the total invested money done.
Now let’s add more complexity to the scenario.
Other example of a decision to be made
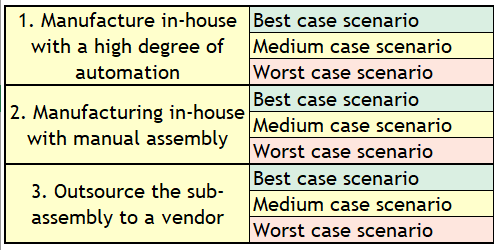
Let’s think in a manufacturing factory, where they have decided to manufacture a sub-product. The decision to be made is how it will be done? They identify 3 options (initial investment required):
- Manufacture in-house with a high degree of automation ($500.000).
- Manufacturing in-house with manual assembly ($150.000).
- Outsource the sub-assembly to a vendor ($0).
The construction in house takes less than a year and the production of the product itself is forecasted to be assembled during 10 years. After these ten years is expected that the assembly of this sub-product will not be required anymore.
The idea behind is to build different use case scenarios where we:
- List the assumptions we consider for each case (it’s not the same to manufacture something for 5 years than to manufacture it for 20 years).
- We consider the climatic patterns that can affect in general to any approach and those that can affect to concrete proposed alternative. They can be a potential risk or opportunity.
- We forecast for each one of the three main alternatives at least three revenue scenarios: best case scenario, medium case scenario and worst case scenario.
- Under these cases, we should calculate the fixed costs and the variable costs.
- To draw on a chart the different break point events (when a proposed solution start to be profitable) give us the opportunity to understand the temporal windows of uncertainty.
- The study of these scenarios are useful sources of identification of hurdles, details about the implementation and risks.
So in the previous section where I commented the example “one branch with three scenarios” is the first branch of this three options: Manufacture in-house with a high degree of automation.
Now for the other two options, you can do a similar analysis with three scenarios and then put all the information together and see what conclusions you can obtain.
One surprise you could have, and it happened to me, is that the combination of the option #1 and #2, where the automation was done with a smaller scope was an option that produced a better outcome in terms of project approach and return of the required investments.
Small amounts in series
There are situations where you assume how the user is going to behave and you perform small investments in different components to learn different things: if the invested money return some value, demonstrate that an idea makes sense, or understand that your company has the capacity to produce certain capability.
If there is return, then the sponsor will continue investing. This type of strategic attitude could be similar to the agriculture that plant different seeds without knowing which one will flower.
These type of decisions are valid in many cases, specially when you are trying to find the market fit or you are creating something new to the user.
Closure
This exercise is simplified and it uses a set of linear forecasting method that in reality cannot be taken into account. But I hope it helps the novel reader to understand the structure you can easily build with these methods.
As it happens with the Wardley Maps, the numbers themselves are not the important thing, the important key value resides in the conversations taken during the analysis and that enable the verification of details, the discovery of new assumptions, risks, and opportunities.