US Balance sheet

This page contains a lot of information that you can consult about US economy: https://www.federalreserve.gov/monetarypolicy/bst_recenttrends.htm The recent communications of the Federal Reserve announcing the use of 2.3T$ can be seen and compared with 2008 figures: There are many other charts and information you can see. My problem: I first have to increase my knowledge to … Read more
Simplywall.st Share Price vs. Fair Value

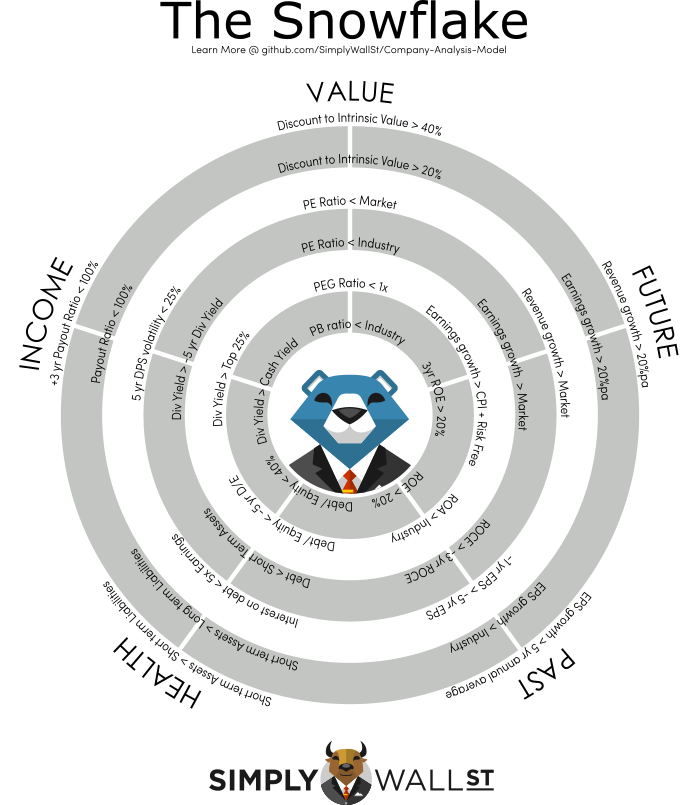
SimplyWall.st has an indicator called: Share Price vs. Fair Value I love it, it allows me to simplify so many things. It’s shown as (stock used Allianz (ALV)): The chart is nice and simple to understand, but the important thing is how the Fair value is calculated, How is the Fair Value calculated on simplywall.st? … Read more

Fundsmith annual shareholder meeting

This video: https://www.youtube.com/watch?v=d3cRr318ve4, is the annual shareholder meeting of Fundsmith. Apart of presenting the results of the year, they review a set of economic fundamentals and behaviors that are communicated in a very didactic way. Basic strategy principles The investment strategy has three pillars that are summed up by the acronym ODD: Only invest in … Read more

Jodi Oil

I found this web that publishes different data related to the oil production and their derivates. https://www.jodidata.org/oil/ You can download the data and prepare more detailed reports, or you can use the graph chart available to draw simple charts.

Stock decisions I did not take

This is a list of events and potential actions I didn’t take, and that I want to remember: Event: Trump won the USA election Action not taken: Buy Goldman Sachs stock. Result in 3 months: stock from 185$ to 250$. Chemours splitted from DuPont, Nelson Petz after Kraft split he invested in Mondelez. Action not … Read more

CAPE or Shiller Ratio

I learned about the Cyclically Adjusted PE Ratio (CAPE Ratio) or Shriller ratio, and I found that in September 2016 this was 26,57. Looking into more data, I found this chart with data since 1880:

Effort to earn 7,5% is tough right now

This graph is very indicative about the huge efforts to perform earnings on financial services right now. They seemed to be easy in 1995, but in 2005 the effort and the risk exposure is so huge. It’s easy to understand why GE sold GE Money, and other major transformations that are happening. How is it … Read more