I have invested some hours learning about Quantopian environment and the basic concepts around the platform. The environment is very powerful, so I wanted to gain some basic clarity of the basis.
Quantopian platform
It consists of several linked components, where the main ones are:
- Quantopian Research platform is an IPython notebook used for research and data analysis during algorithm creation. It is also used for analyzing the past performance of algorithms.
- The IDE is used for writing algorithms and kicking off backtests using historical data.
- Paper trading ability, so you can perform simulations using live data.
- Alphalens is a Python package for performance analysis of alpha factors which can be used to create cross-sectional equity algorithms.
- Alpha factors express a predictive relationship between some given set of information and future returns.
- help: https://www.quantopian.com/help#optimize-title
The workflow
To maximize the use of Quantopian is important to understand how to work on the different steps to achieve your goals.
The basis are the same ones that the ones explained on this post, and that are represented by this diagram:
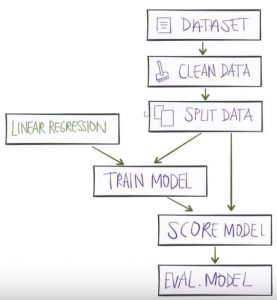
I did not found a diagram in any place, so I draw my own diagram.
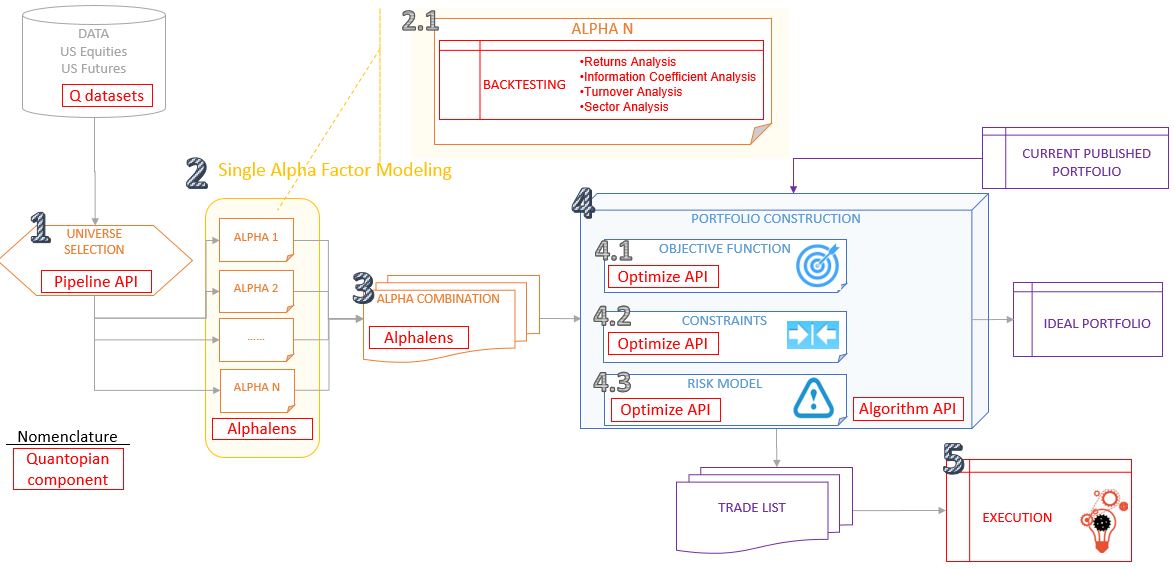
Workflow, step by step
1.Universe Selection: define a subset of tradeable values (stocks/futures); the universe should be broad but have some degree of self similarity to enable extraction of relative value. It should also eliminate hard to trade or prohibited instruments. (Example: select companies with >10B$ revenue and dividend rate >3%).
This is done throught the object named “Pipeline”. The idea is not to limit yourself to a set of specific stocks but define a pipeline of stocks that allow you to quickly and efficiently consider many thousands of companies.
Pipeline allows you to address all companies, then filter them.
2.Single Alpha Factor Modeling:
Initially these 4 words together sounds like chinese to me. So I will try to explain as I understood it: it’s a model composed by a single factor that tries to find a result that has statistical significance (alpha factor).
Not enough?, Ok, I will try to explain some concepts.
First, I need to review some basis of statistics.
What is an alpha factor?
In statistical hypothesis testing, a result has statistical significance when it is very unlikely that it has occurred randomly. The level of significance is commonly represented by the Greek symbol α (alpha). The significance levels of 0.05, 0.01 and 0.001 are common.
What is a factor model?
A model in quantopian is composed by a set of factors; usually it should include:
- a factor for the market,
- one or two factors for value/pricing,
- and maybe a factor for momentum.
Now let’s come back to Quantopian Single Alpha factor Modeling.
It is basically to define and evaluate individual expressions which rank the cross section of equities in your universe. By applying this relationship to multiple stocks we can hope to generate an alpha signal and trade off of it.
This can be done in 2 ways:
- Manually: Hand crafted alphas. By the moment I will start with this method.
- Deep Learning: alphas are learned directly, instead of defined by hand (Long-short term memory (LSTM), 1D convolutional nets). I will let this method for later.
Notes:
- Developing a good alpha signal is challenging (for instance: detect an earning surprise before the formal announcement based on sentiment data).
- It’s important to have a scientific mindset when doing this exercise.
By being able to analyze your factors in IPython Notebook you can spend less time writing and running global back-tests. It also enables you to annotate assumptions and analyze potential bias.
This is in deed the main function of Alphalens python package: to surface the most relevant statistics and plots about a single alpha factor. This information can tell you if the alpha factor you found is predictive. These statistics cover:
- Returns Analysis.
- Information Coefficient Analysis.
- Turnover Analysis.
- Sector Analysis.
3.Alpha Combination: you basically combine many single alphas into a final alpha which has stronger prediction power than the best single alpha. Two examples about how to do it:
- Classifier (E.g.: SVM, random forest).
- Deep Learning: alphas are learned directly, instead of defined by hand (Long-short term memory (LSTM), 1D convolutional nets).
For simplification I have started just with 1 alpha factor, so I am right now skiping this step.
4.Portfolio Construction: implement a process which takes your final combined alpha and your risk model and produces a target portfolio that minimizes risk under your model. The natural steps to perform it are:
- Define objective: what you want to maximize.
- Define constrains: such leverage, turnover, position size…
- Define risk model: define and calculate the set of risk factors you want to use to constrain your portfolio.
5.Execution: implement a trading process to transition the current portfolio (if any) to the target portfolio.