The beginning
On August 3rd 2018 I wrote about some behaviors of S&P. These behaviors and my desire to develop reports to understand trends at monthly level took me to draw this figure the same day: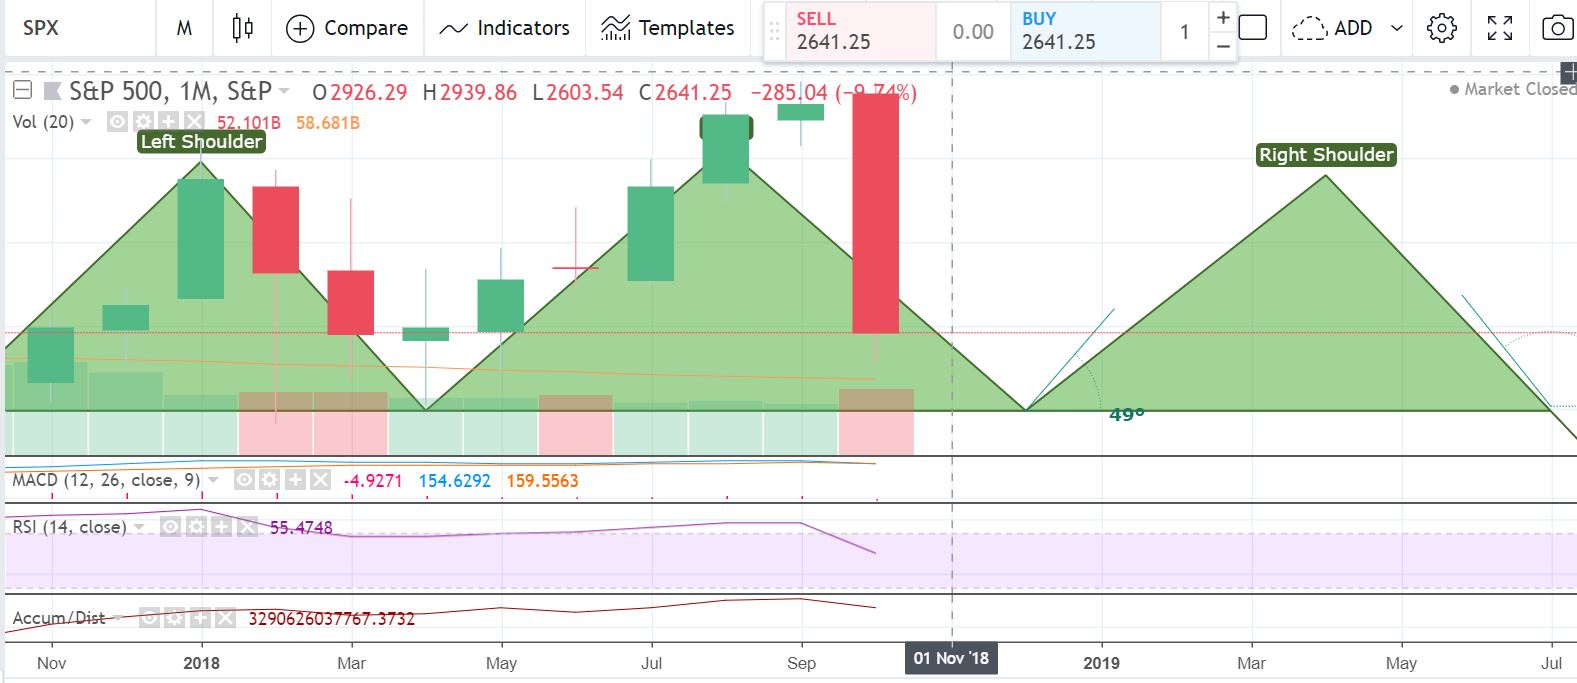
How things happened in the calendar
At the end of August I took the decision that I was going to sell the majority of my positions. I did it.
In September I was astonished with the defiance to gravity of the market and a little bit pissed-off with the trend.
Now in October, specially in the second half of the month, I have seen how this has been evolving. The Q3 closing reports seemed to be the flutter of the butterfly that changed the trend.
The feeling
It’s just a graphic, it’s just a figure, it’s just a coincidence, but I’m happy about all I learned to be able to draw it.
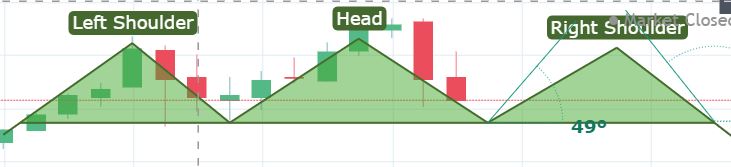
Update November 23rd 2018
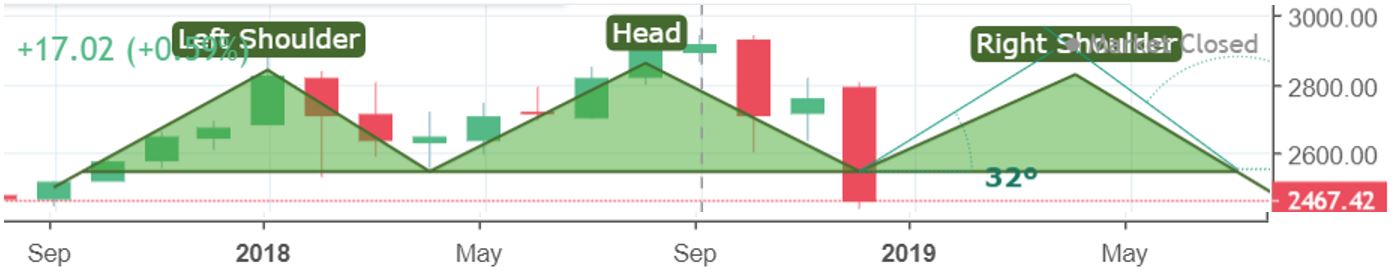
 Update December 22nd 2018
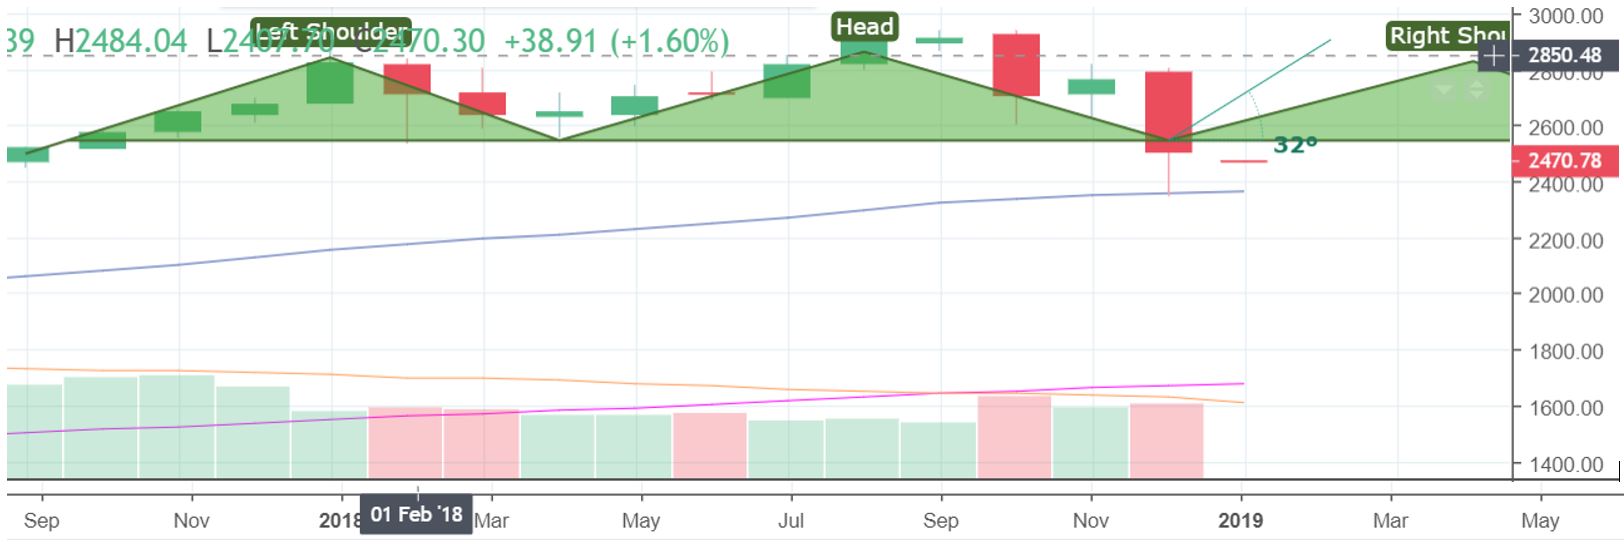
Update January 2nd 2019
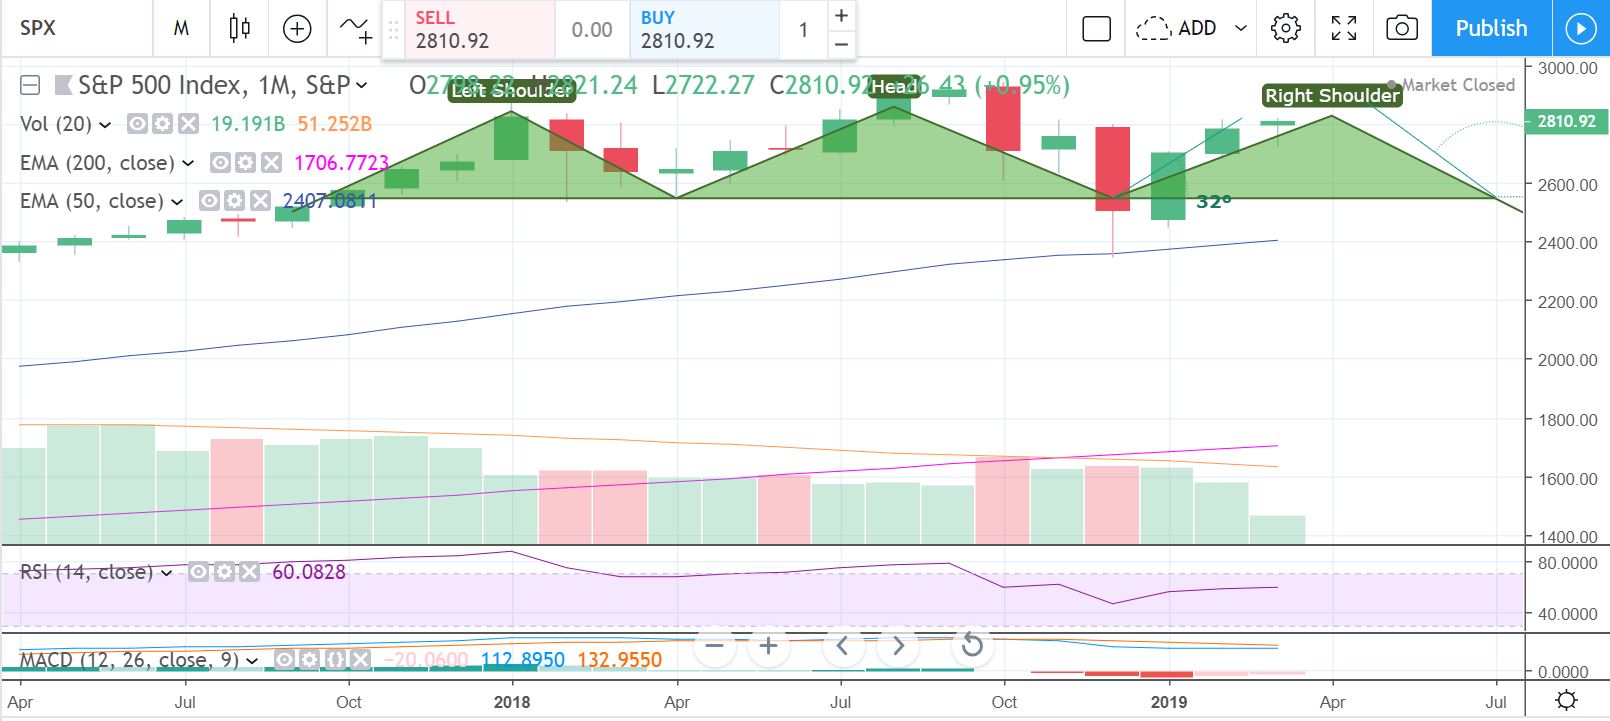
 Update March 14th 2019
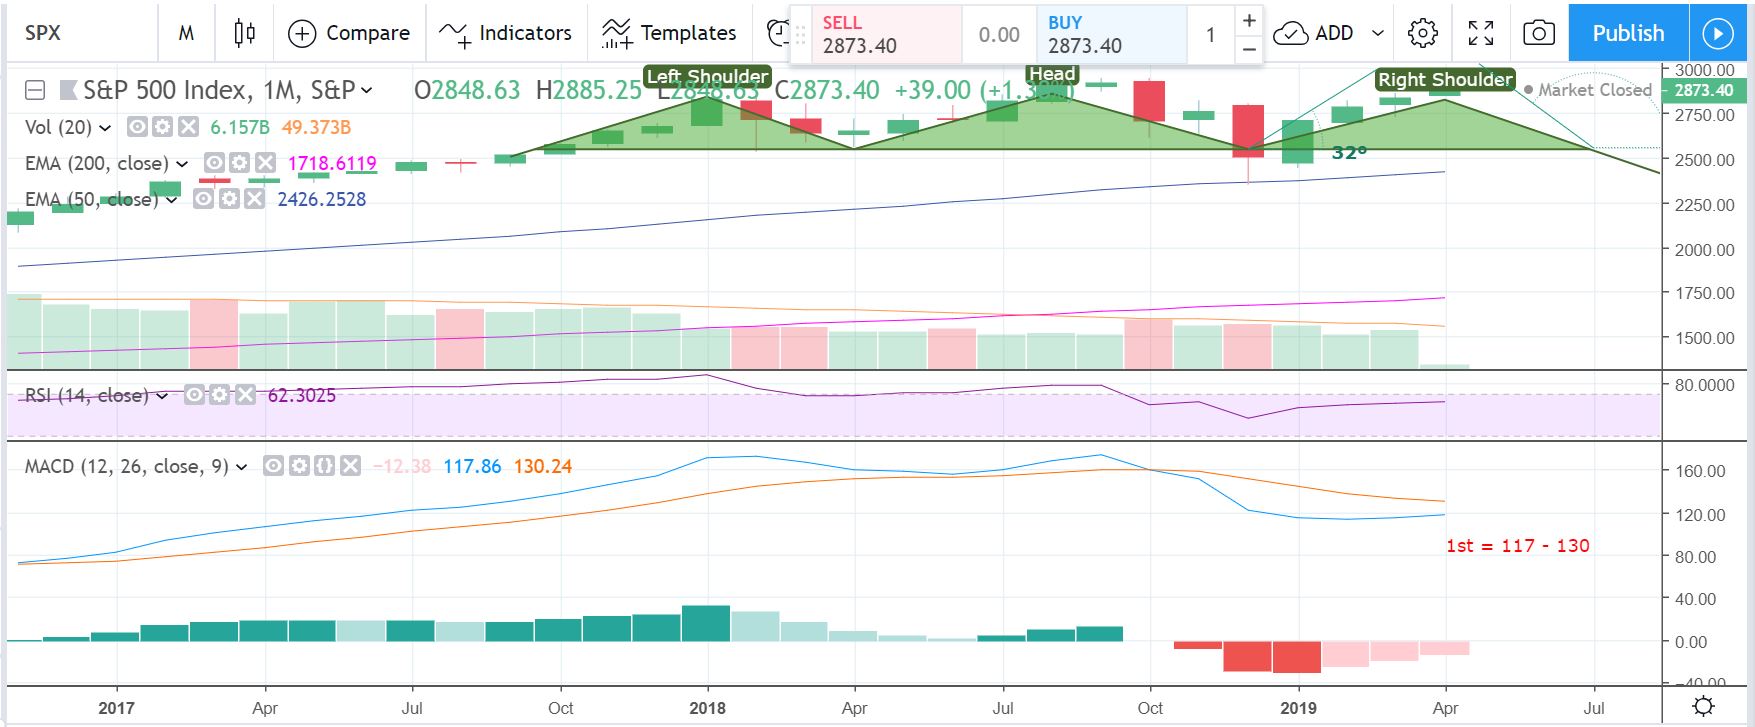
 Update April 3rd 2019
 Update on September 30th 2019
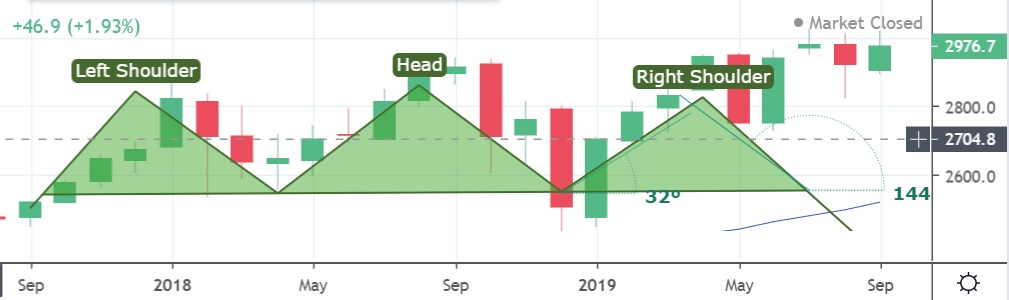 At the end,I was wrong, the S-H-S figure was not drawn. I was expecting a fall in May and it did not happen.
Fortunately to me, I did 2 big moves in the right moment and 1 move in the wrong moment:
The right ones:
- August 2018: sell.
- January 2019: buy.
The wrong one:
- April 2019: sell