I am writing this review of Autodesk Inc. focusing on a major milestone of the evolution of the company in the last recent years. I’m not Autodesk employee and I have never worked for them. I used AutoCAD when I was in college (when you were required to install with 11 floppy disks).
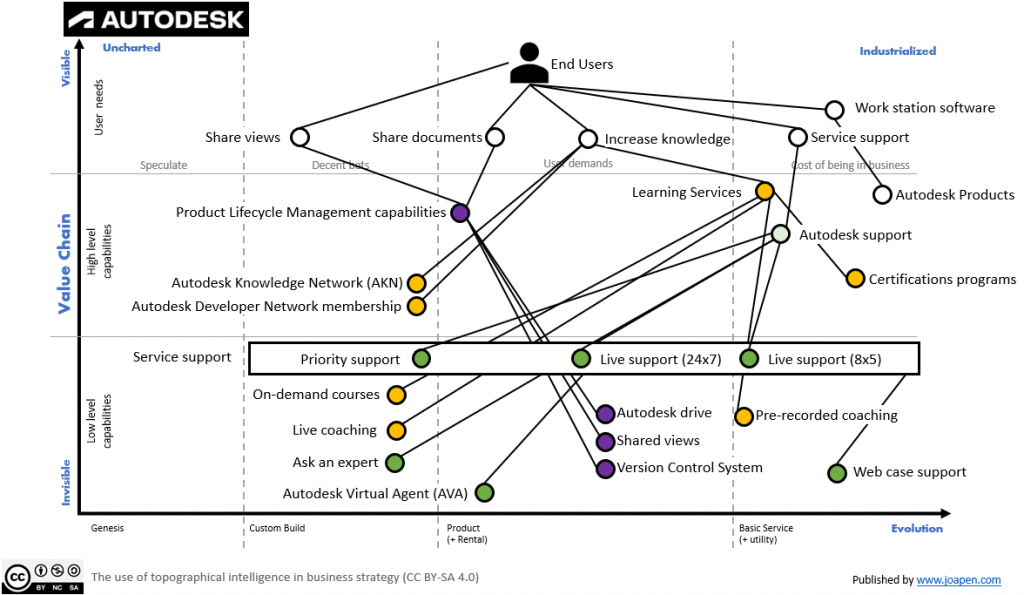
This map was shared in the Map Camp use case edition done in November 2021 (video).
Finance
I build a report in TradingView about the progress of the main fundamental data of the companies, and this is the one for Autodesk:
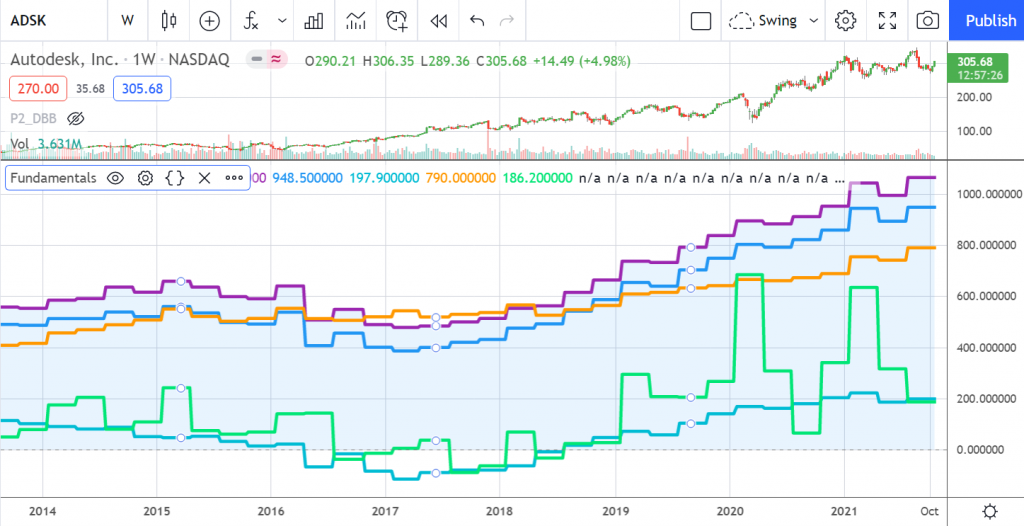
Note that gross profit (light blue line) was negative in 2017.
So looking at debt & equity, we can notice as in the middle of 2015 Autodesk started to increase the debt projecting a decrease in the equity and cash, which really happened between 2016 and 2020.
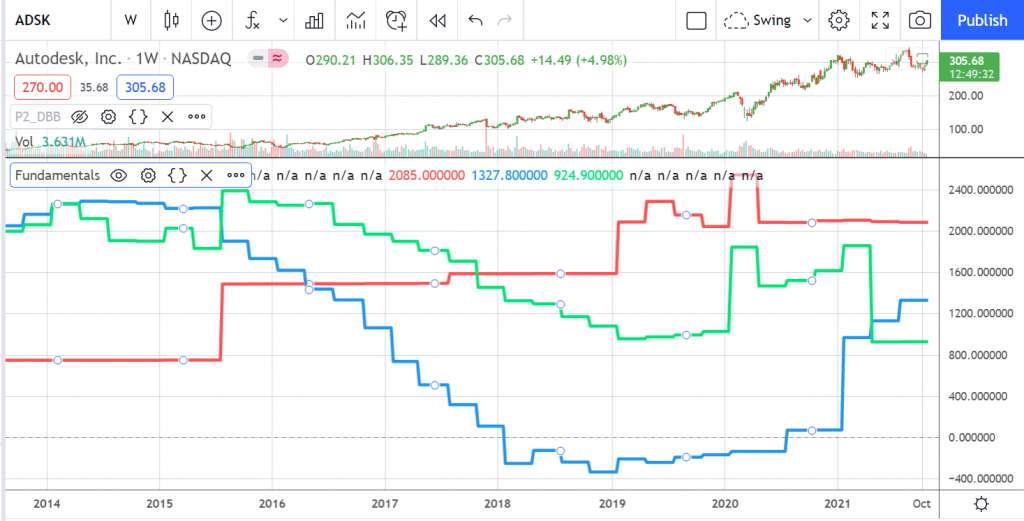
In terms of returns, I consider that >20% it’s a healthy return. Autodesk increased the investments in R&D till 2018, where they slowed down. ROIC in 2020 jumped into 50%. I have not added ROE, and you will see the reason below.
ROE was bad starting in 2016 and a disaster during mid-2018 and 2021.
In summary, some major decisions were done in middle 2015, in 2016 and they hit rock bottom in 2018 where things started to ramp up.
Let’s jump into 10k data
I use my TradingView report to get some perspective, but when I want to dig into details I go to annual 10k reports. They are sent to the SEC (US regulator), so the amount of “bla, bla, bla” is limited. In the case of Autodesk, these are the 10k reports.
All information that I’m adding is basically from these reports. I have started on FY16 that corresponds to 2015, and I have stopped in FY21.
Some data & events
- CEO Carl Bass was replaced by Andrew Anagnost in 2017.
Main business units
You can take so many details of the business units in the Wikipedia.
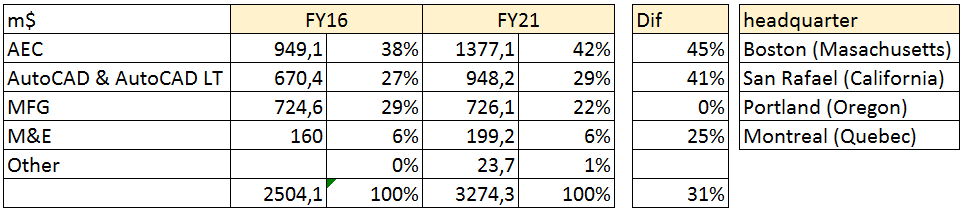
Note that each unit keeps their own headquarter, which seems to be a sign of leaving autonomy to each business.
Later you will see the list of acquisitions since 2016, and the main units benefited by acquisitions are AEC and AutoCAD.
Media & Entertainment works with customers as Disney, there are no major acquisitions on this area.
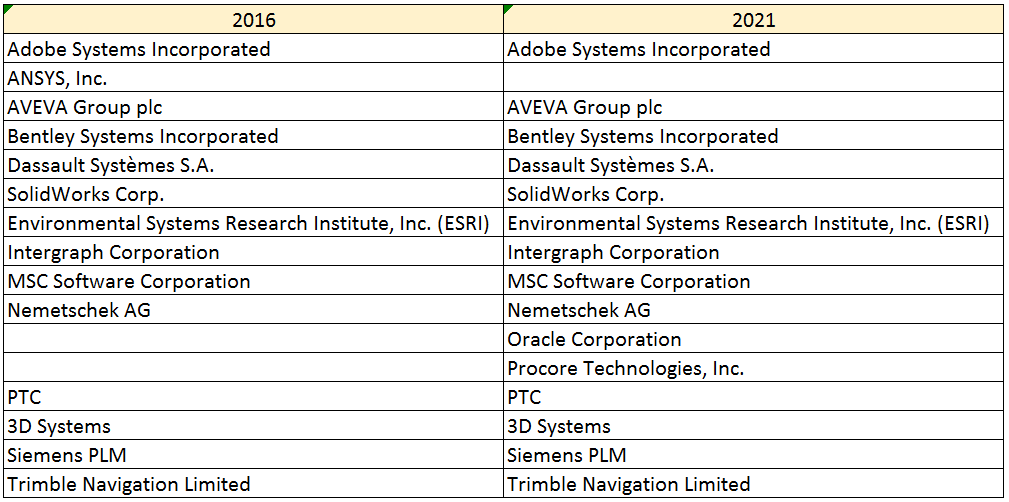
Competitors
There is a climatic pattern that is “Competitors actions will change the game” , so it’s at least interesting to see who are the Autodesk’s competitors.
The amount of competitors are very diverse for Autodesk as there are so many niches where they are working. I have done a table with the competitors they recognized in their annual report of 2016 and 2021.
Product lifecycle management
The amount of specific products that has been discontinued by Autodesk during their whole history is amazing. They keep the minimum necessary products so they can focus R&D investment.
The list of acquisitions gives you some idea about the direction of the capital:
- 2015 = 1, SeeControl (an enterprise Internet of Things (IoT) cloud service platform).
- 2016 = 2, SolidAngle, (creator of the Arnold rendering software), CadSoft Computer GmbH (creator of the PCB design software EAGLE).
- 2017 = 0,
- 2018 = 3, PlanGrid (Construction productivity Software), BuildingConnected (construction bid-management platform), Aurigo Software (full lifecycle cloud software to plan, design, build and operate construction assets).
- 2019 = 0
- 2020 = 4, Bridgit Bench (an online construction work force and resource planning software), Pype (cloud-based solutions for automating construction project management workflows), Spacemaker (cloud-based platform which uses AI and generative design to rapidly create, optimize, iterate, and evaluate design alternatives for buildings).
- 2021 = 1, Innovyze (smart water infrastructure modeling and simulation technology).
The move from License & maintenance to subscription
The software and infrastructure world was moving from “CAPEX + OPEX” model to a “SaaS” model. There is a climatic pattern: no choice over evolution (Red Queen), that explains it.
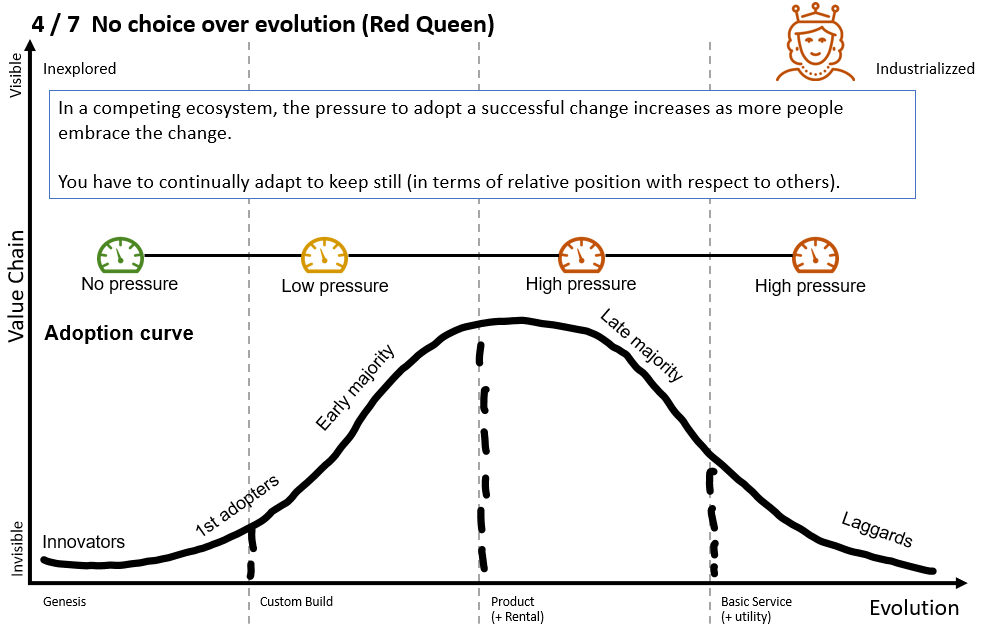
The generic software companies where doing it in 2010 – 2014, and the niches of specialized software would have to be the next ones to make that jump.
When did Autodesk started to do it?
I cannot know when and how Autodesk detected the move of the industry but in FY16 report they already has started to experiment with a new subscription model. The niche used was “desktop license” in their flexible enterprise offerings.
- In FY16, they do a decision: “effective February 1, 2016, we discontinued the sale of new commercial seats of most individual software products, which are now exclusively available by desktop subscription, and we plan to discontinue selling perpetual licenses of suites products effective August 1, 2016”
- In FY16 Autodesk reported a New Annual Recurring Revenue Model (ARR model).
- In 2018, they launched a program named “move to subscription” M2S program, where Autodesk basically was pushing the model from license + maintenance model to a subscription model. My understanding is that they were facing issues with some major customers and they defined this specific plan to get it done.
- In FY19 they decided to close the business unit Genetic Engineering, which was absorbing a lot of R&D budget to generate visual tools for genetics.
- The Annual Recurring Revenue metric had more importance with the change promoted by M2S program.
- In FY20 they mentioned how successful is being the M2S program.
- The maintenance plans were retired on May 7, 2021 and multi-user subscriptions maintenance were retired on August 7, 2022.
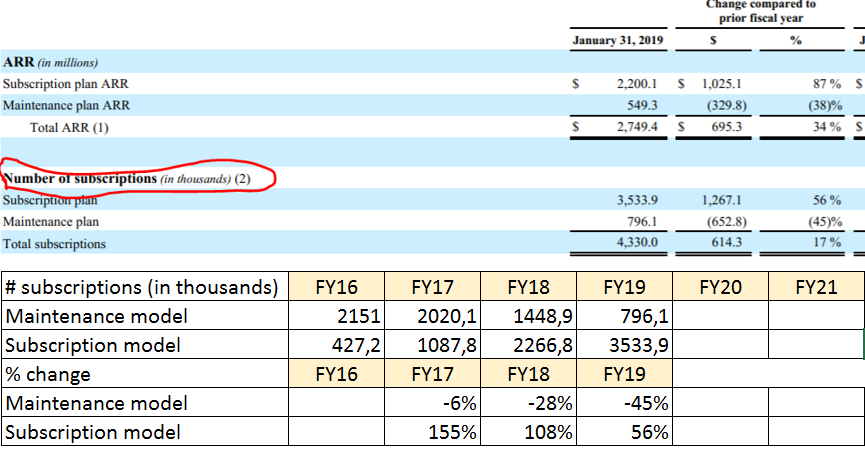
Between FY16 and FY19, Autodesk reported the number of subscriptions and maintenance, but they stopped on FY20. I have checked in FY15 report and the table does not exist. In any case, you can see how the move from one model to other was happening in the table below:
A couple of maps
I was not able to find information about how the license structure was build in the past, so I could try to draw the evolution of the specific products from the license + maintenance model to the subscription model.
In any case, I will jump into the swimming pool and I will draw a couple of maps.
Remember some principles:
- All maps are wrong, some are useful.
- Mapping equation = draft map + feedback, so feedback is welcome.
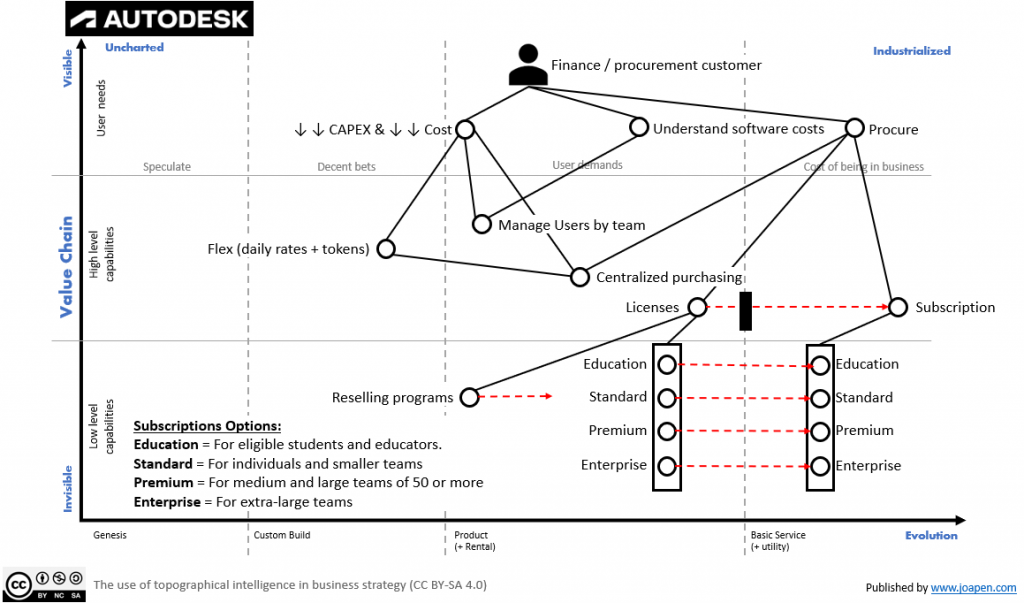
The end user of the products
The first error I have done is to draw the users as individuals, when the reality is that in so many cases there is a group of users that belong to an engineering department or a media company.
I have added what I think they are the basic needs that are offered to almost all family of products, and I’m sure that I’m wrong as the diversity of products in Autodesk is high (sorry for that).
As the map is a little bit messy, I have added some colors so the reader can identify to which belongs what.
Procurement & Finance people of the customer company
The basic needs are on top of the map, the basic move to which Autodesk was forced by the general trend to utility can be simplified as this:
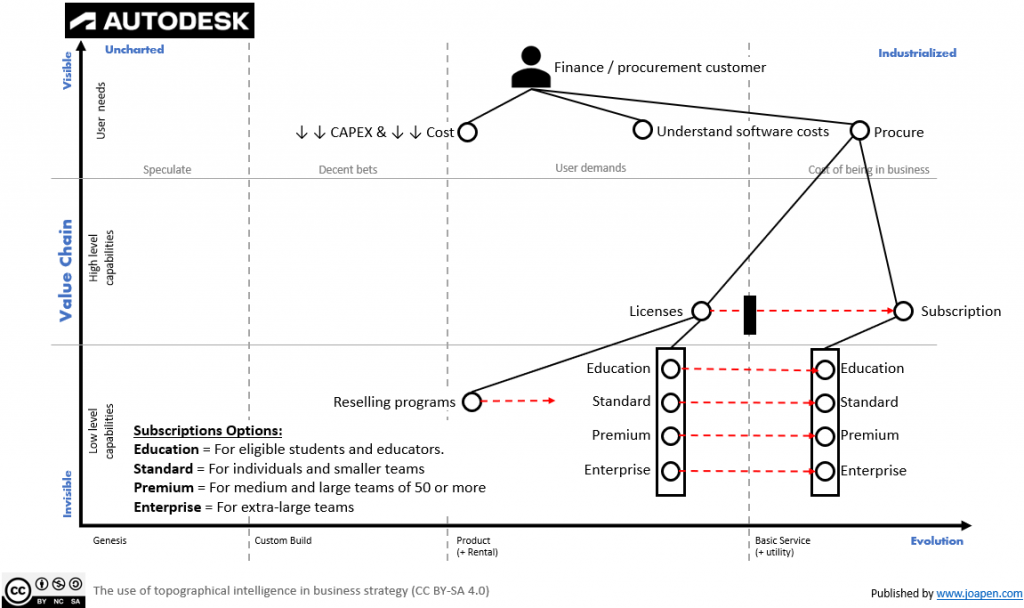
The work done between 2016 and 2020 where the main volume of customers were moved to subscription model have some risks and it complexity:
- Major agreements with enterprise customers.
- Resellers deals.
- Different types of maintenance supports.
As commented before, the point is that Autodesk was affected by the climatic pattern ” no choice over evolution”, so they have to move ahead and overcome the inertia.
Once the decision was done (in beginning of 2016), the company had a direction and everybody moved into that direction. In sure these were tough times. The point is that there is a climatic pattern that says: Efficiency does not mean reduced spending (Jevon Paradox).
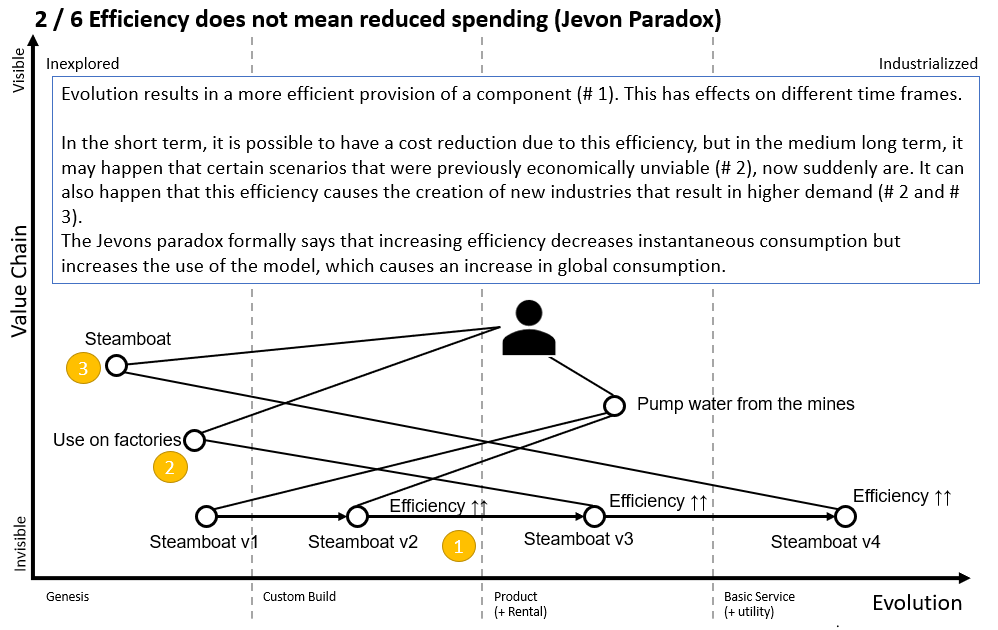
The fact that the companies can acquire the Autodesk products in a more granular way, and access to specific services that add value to their companies, makes that initially the expenditure is reduced, but as the Jevon’s paradox mentions, if the utility provides the right value the long term consumption will be increased. If you look again in the revenue figures from 2019 and 2020, you can see it clearly.
This does not come alone, Autodesk have built a set of capabilities to enable the auto-self service for the customers and this is making them to manage their subscriptions and extra services they require.
Note that the reseller program exist and the partners are named “value added reseller” (VAR).
Summary
Autodesk have transformed their selling model completely in the last 7 years going from a “licenses + maintenance” model to a subscription model while they have been improving their offerings and ways to increase the user experience (use of cloud platforms for specific needs).
We have to remind that Autodesk had many different plans for unique users, and multi-users accounts with different sizes. Ah!! and remember they have a resellers program around the world where Autodesk partners sell their products. So the move to a subscription model have a lot of implications and tensions to resolve.
The journey during these 3 years (2016 – 2019) have been tough (go and look at the financial numbers again, numbers turned very nasty).
What’s next?
.Well, Autodesk continue investing a lot of $$ in R&D and the specialization of their products continue. I can see that civil engineering, cloud solutions, 3D and the addition of specific calculations for constructions products are the hot topics they are working on.