I found this diagram created by Howard Marks.
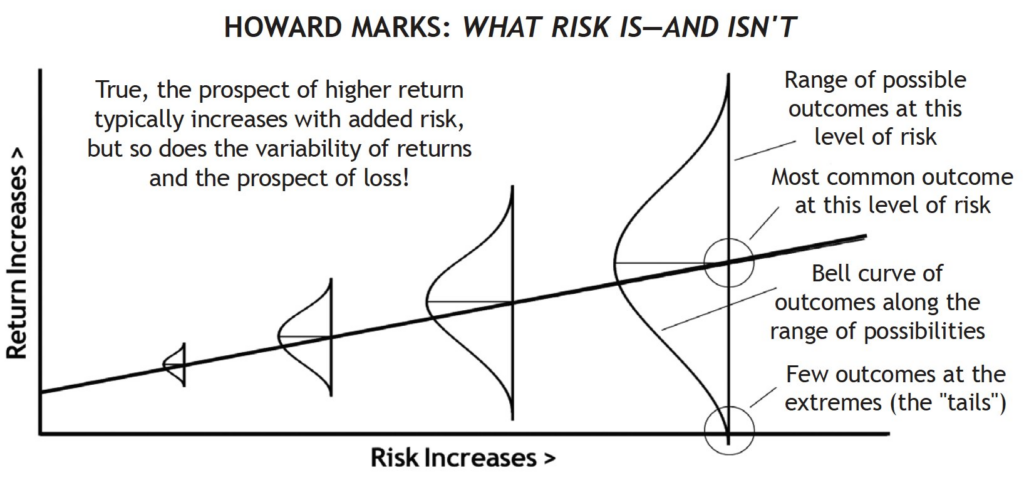
In Howard Marks’ framework, Beta (systematic market sensitivity and price volatility) is not explicitly labeled, but it is structurally represented through two key elements in this chart: the horizontal axis (“Risk Increases”) and the widening spread of the bell curves.
Beta measures relative volatility.
The title of the graphic—“What Risk Is—And Isn’t”—is a direct reference to Marks’ famous critique of Beta:
- What Beta is here: Beta accurately maps the volatility (the height of those bell curves) and explains why higher-volatility assets must offer a higher expected return (the upward-sloping line) to attract investors.
- What Beta isn’t: Academic finance equates Beta (volatility) with risk. Marks argues that volatility is merely a symptom—true risk is the probability of permanent capital loss (represented by the lower tails dipping below the zero-return threshold on the far right). If an asset has high Beta (wide swings) but you aren’t forced to sell at the bottom, Marks doesn’t consider those temporary fluctuations to be true risk.
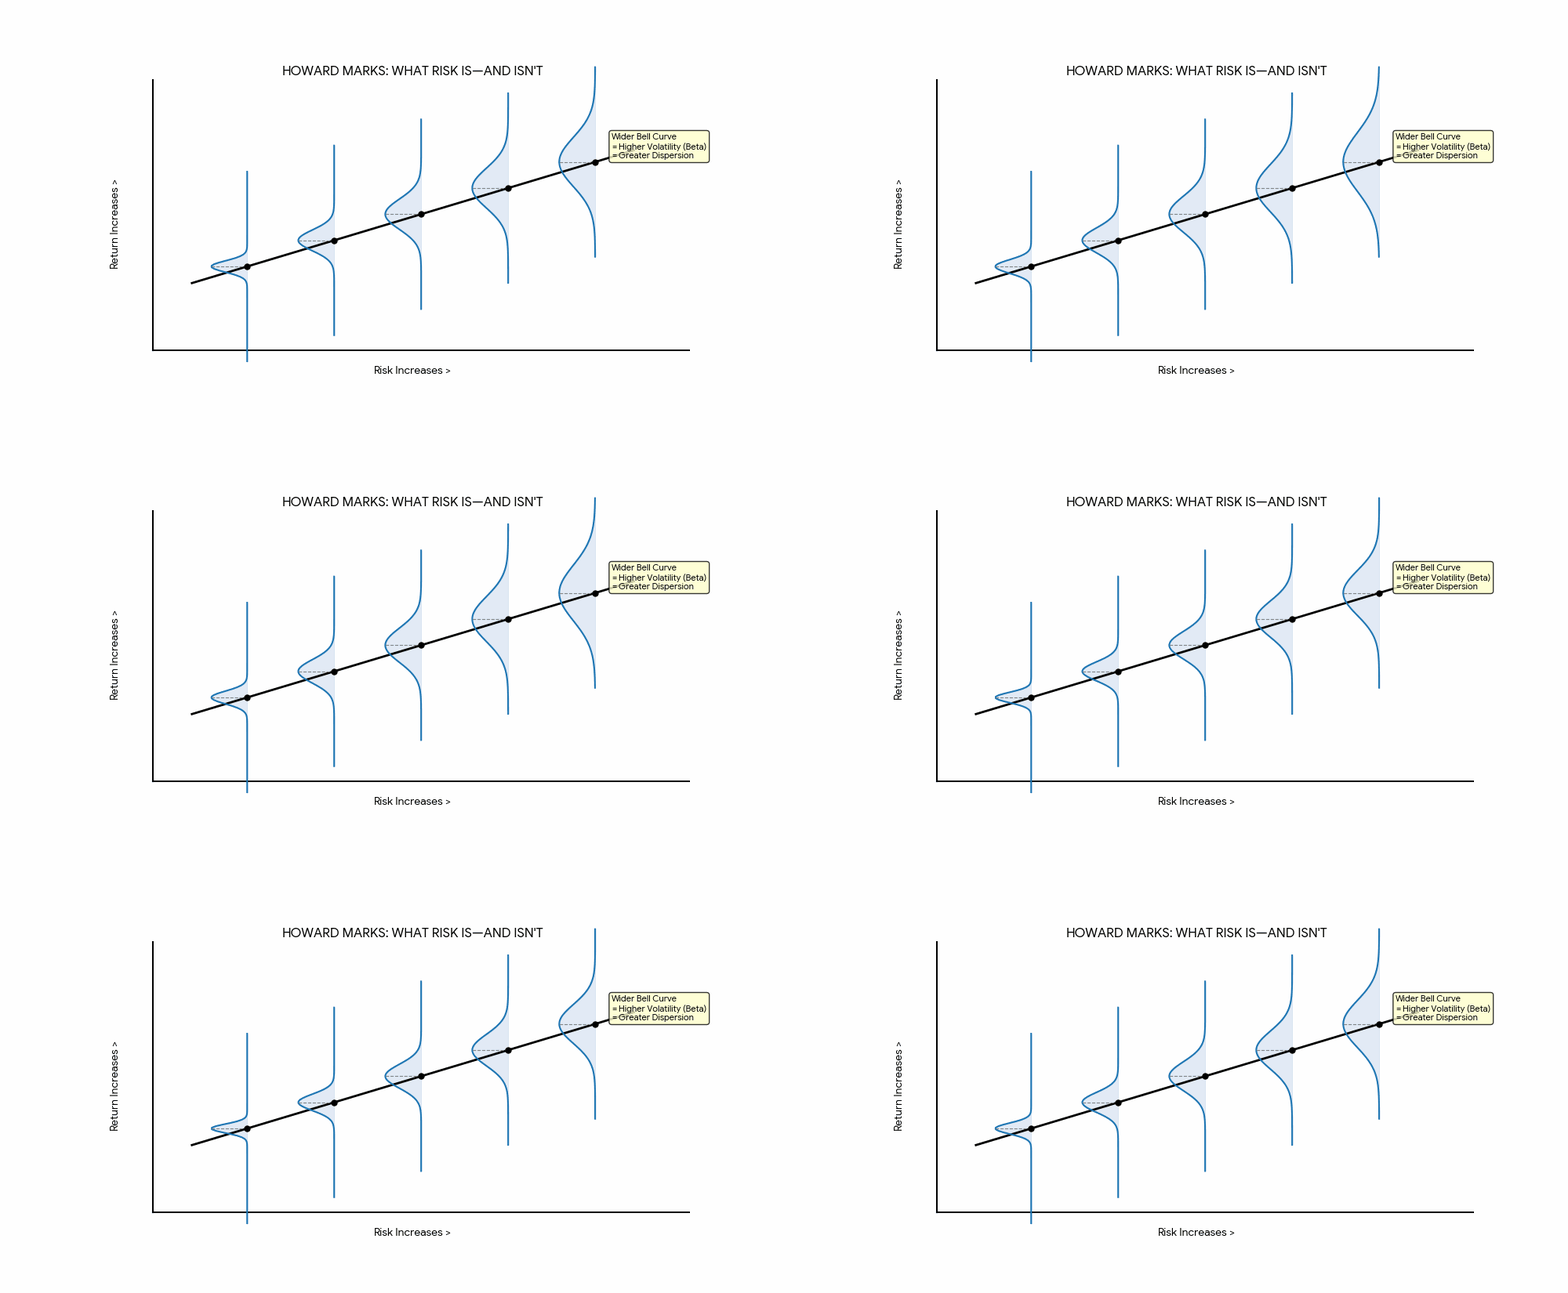
I was curious about the dynamics represented in the original diagram, so I asked Gemini to generate an animated Gif with the dynamics that Howard Marks wanted to represent.
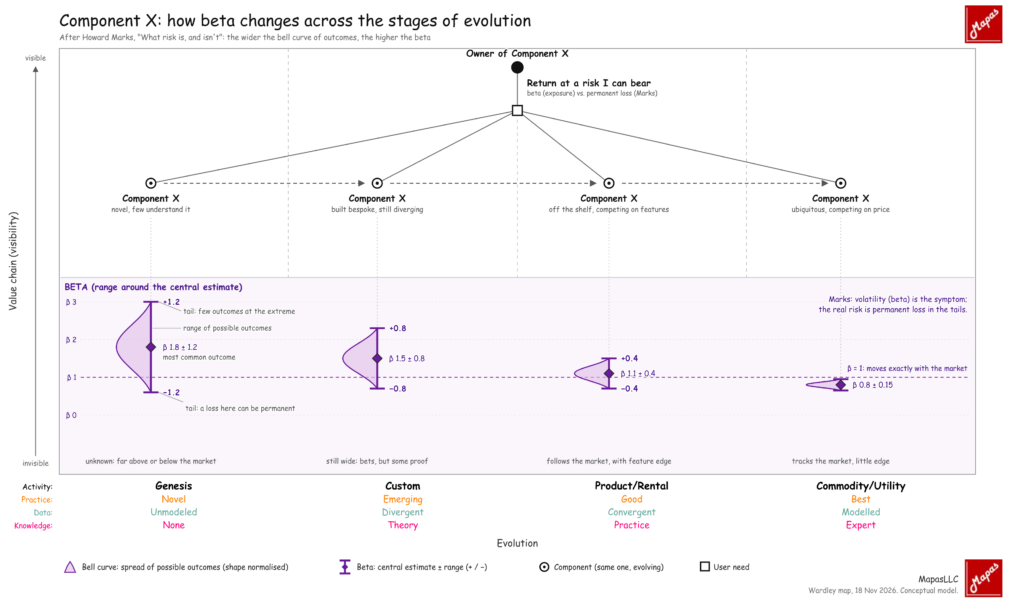
The representation in a Wardley Map is a little bit different,
 WordPress
 Google +
 Facebook