I’ve been playing with the concepts of alpha and beta used in stock trading.
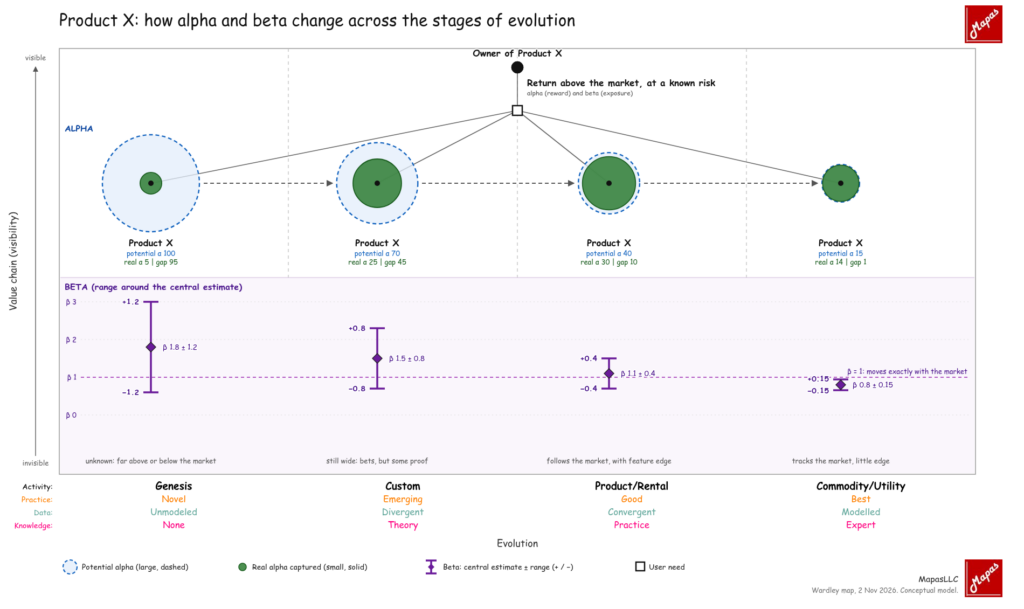
Using an user which unique need is “Return above the market, at a known risk”. Product X is drawn four times, once in each evolution stage, with dashed arrows showing it moving right. You can think into a product or a company.
- Potential alpha shrinks as competition erodes the edge. Real alpha peaks in Product/Rental, and the gap between the two circles closes as the product commoditises.
- The range is widest in Genesis, where outcomes diverge, and narrowest in Commodity, where the product behaves like the market beta=1 means Product X moves with the market.
Another consideration done: I used the stock-trading meaning for both terms. Alpha is value above the market, and beta is the owner’s return sensitivity to the market.
My interpretation of these concepts with respect a given product (Product X) can be confused with the concepts of alpha and beta used in the prices of stocks.
To me, the interesting side of visualizing in this way is to represent the fact that when something has high beta also has high risk.
How do you see companies and products in a map when combining with these concepts?
 WordPress
 Google +
 Facebook